Title here
Summary here

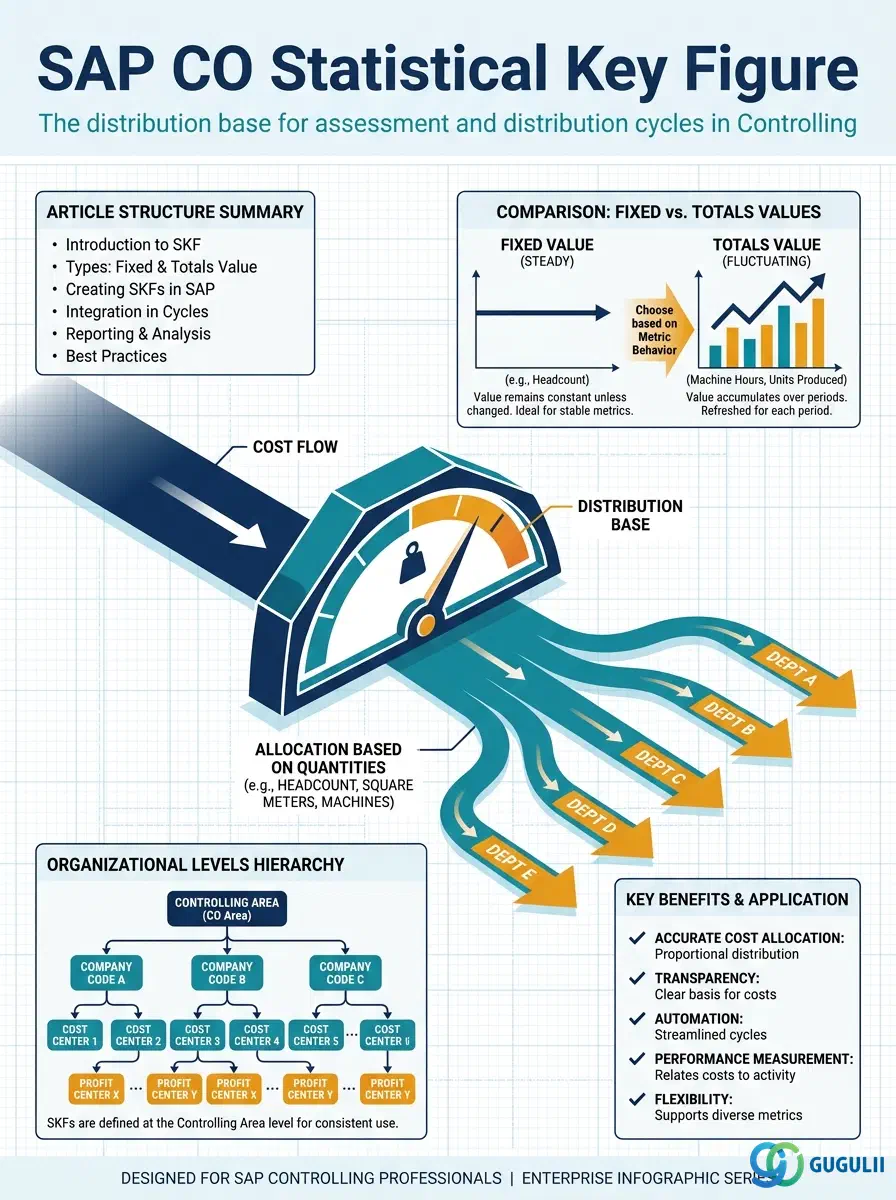
The Statistical Key Figure (SKF) is a quantity-based measure used in SAP Controlling as the distribution basis for period-end assessment and distribution cycles. While Activity Types allocate costs based on a service output (hours worked, machine time consumed), the Statistical Key Figure allocates costs based on a structural or usage metric — number of employees, square meters of floor space, number of IT users, kilowatt-hours measured at the meter — that may have no direct causal link to a specific activity. SKFs are the standard tool for distributing overhead costs like building maintenance, cafeteria costs, or IT infrastructure charges to the Cost Centers that consume those services.
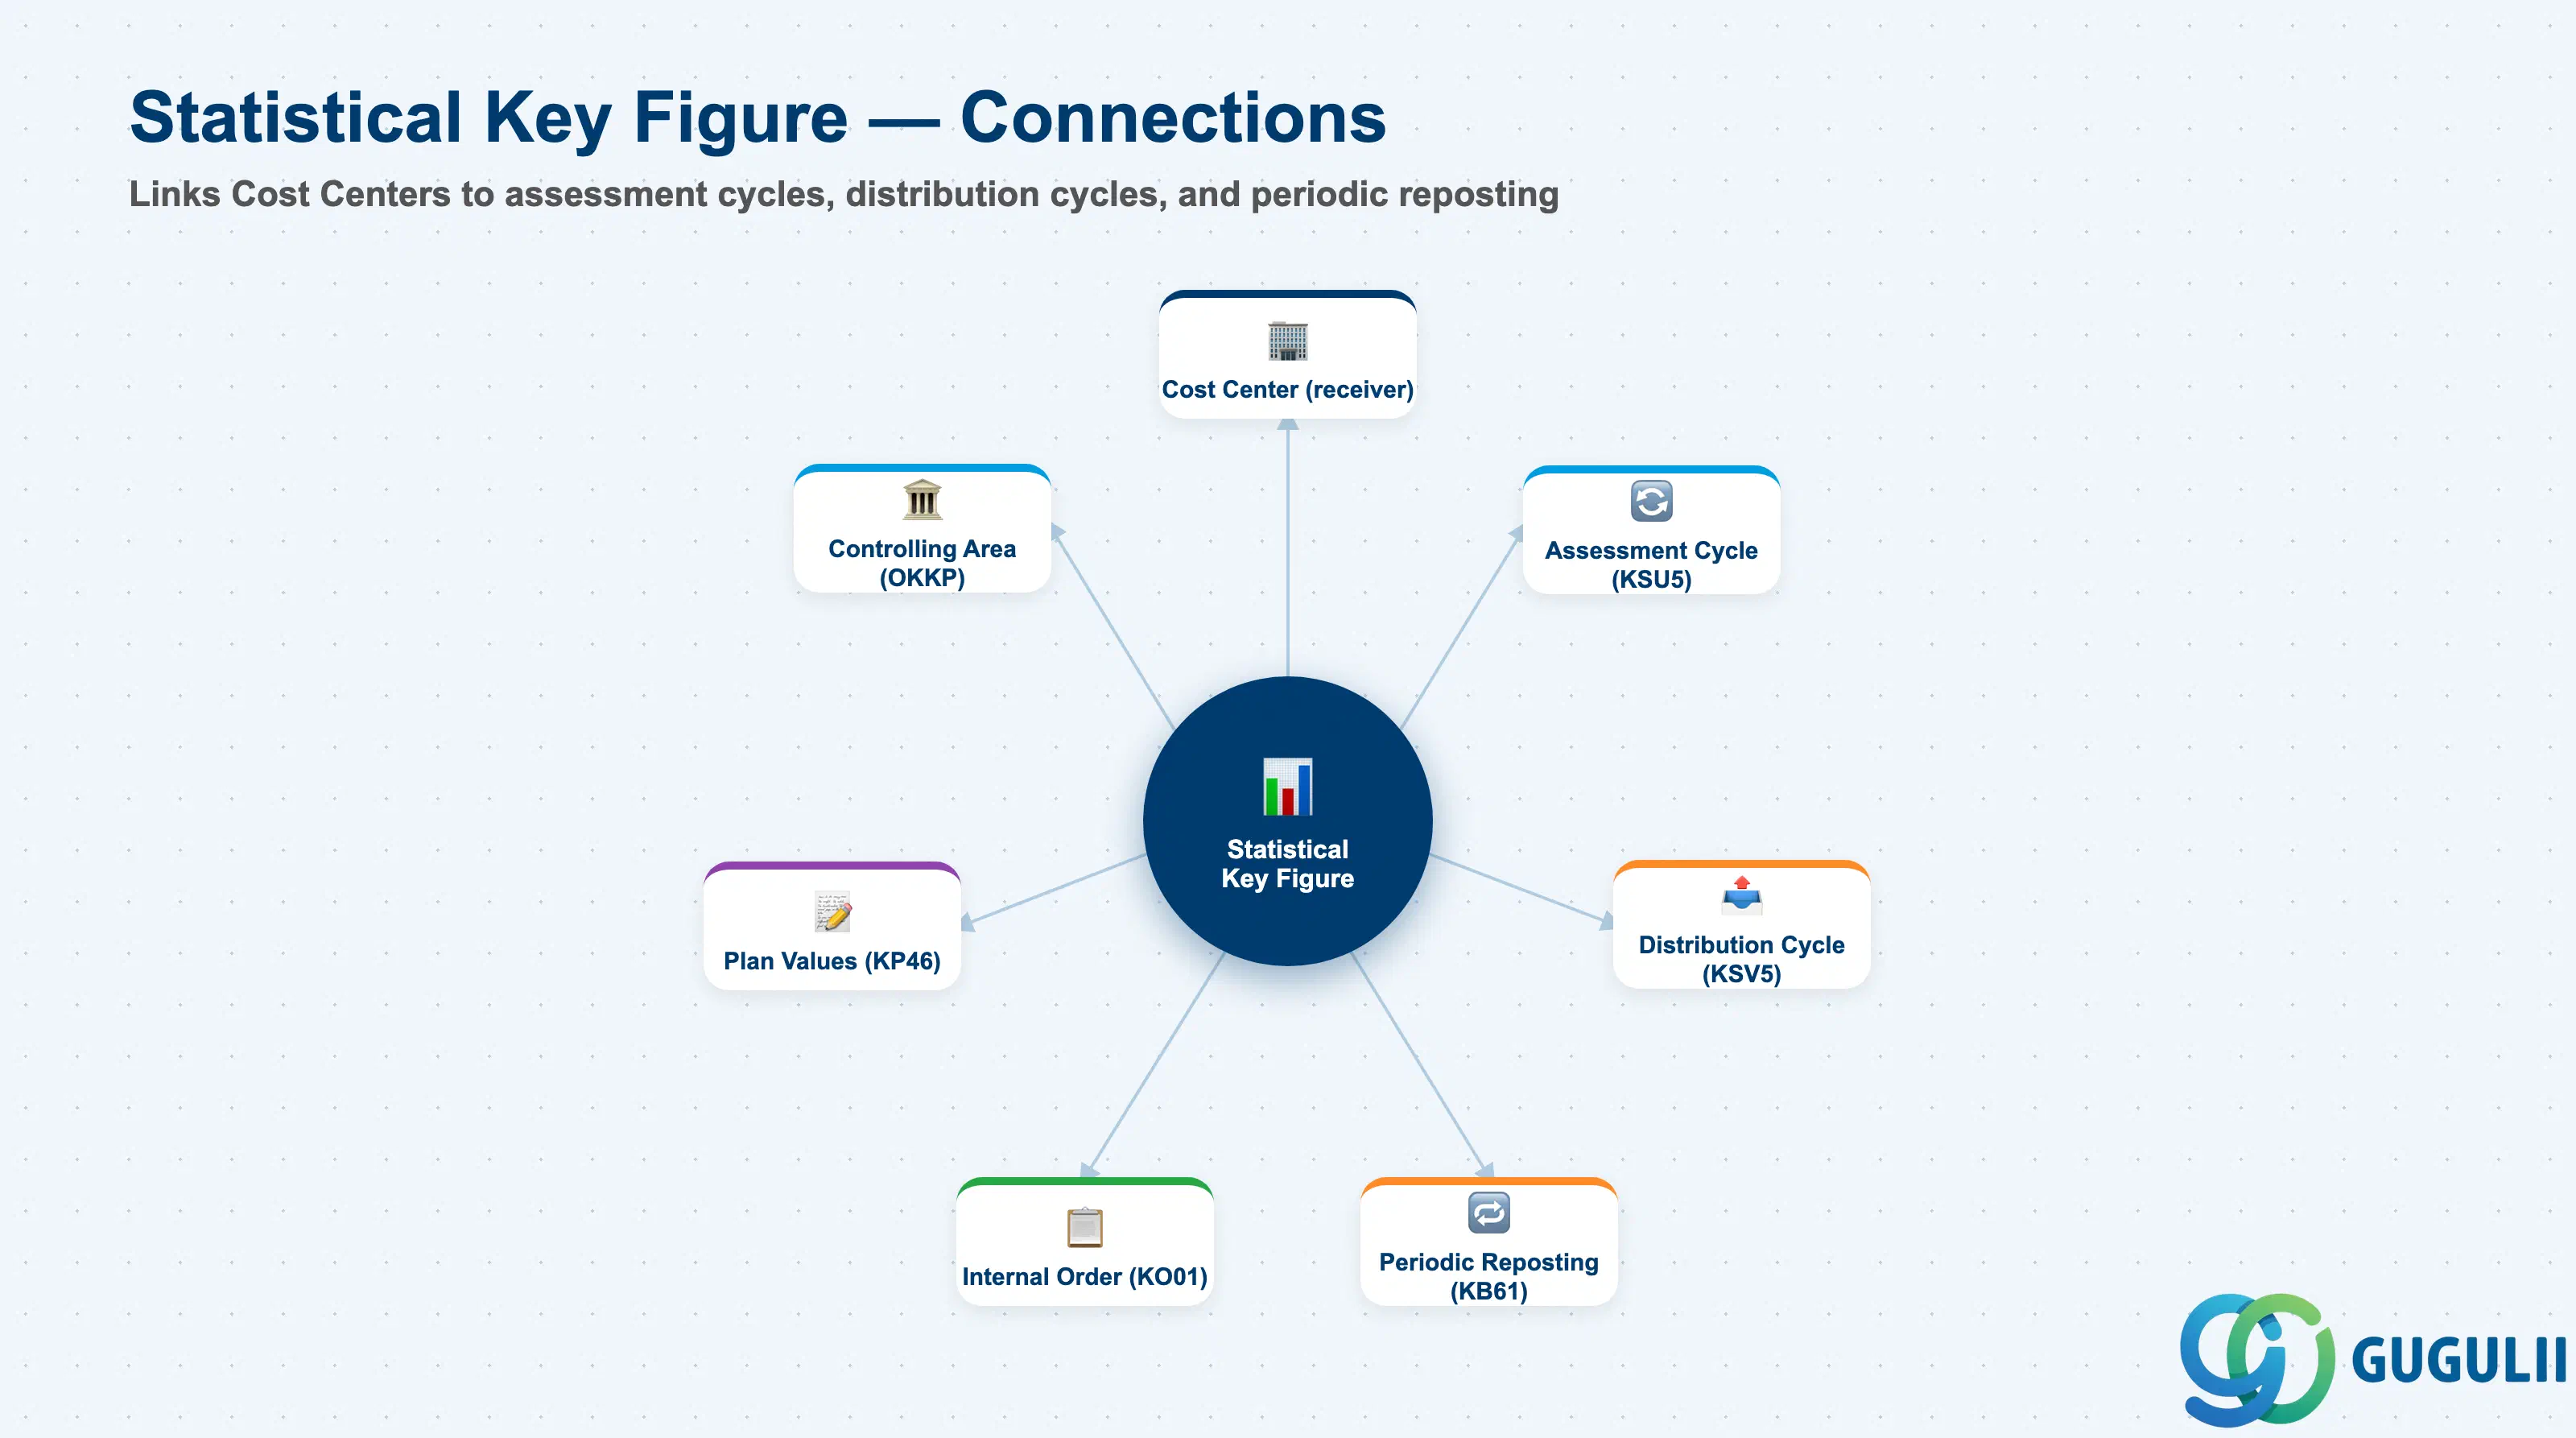
The Statistical Key Figure is a named quantity measure that can be planned and posted per Cost Center (and per Internal Order) per period. The values are “statistical” in the sense that they do not represent a cost posting — no G/L or CO debit/credit is created when an SKF value is entered. The values serve as the denominator (distribution base) in assessment and distribution cycles, determining how much of the sender’s cost pool flows to each receiver.
| Aspect | Details |
|---|---|
| Role | Provides a non-cost quantity measure as the distribution base for assessment and distribution cycles — enables cost allocation based on structural metrics (headcount, area, transaction volume) |
| Modules using it | CO-CCA (assessment and distribution cycles), CO-IO (order-level statistical postings for tracking), CO-PA (statistical key figures as characteristics in PA transfer) |
| Transactions | KK01 (Create), KK02 (Change), KK03 (Display), KB31N (Enter Actual SKF values), KP46 (Plan SKF values) |
| Key Tables | CSSK (Statistical Key Figure master data), CSKA (shared with Cost Element master for text), COSS (CO object line items — statistical postings) |
| S/4HANA note | Statistical Key Figure functionality is unchanged from ECC. In S/4HANA, actual SKF values can be entered manually (KB31N) or imported via interface (IDoc / BAPIs). The Fiori app “Enter Statistical Key Figures” provides a simplified UI for period-end SKF input. |
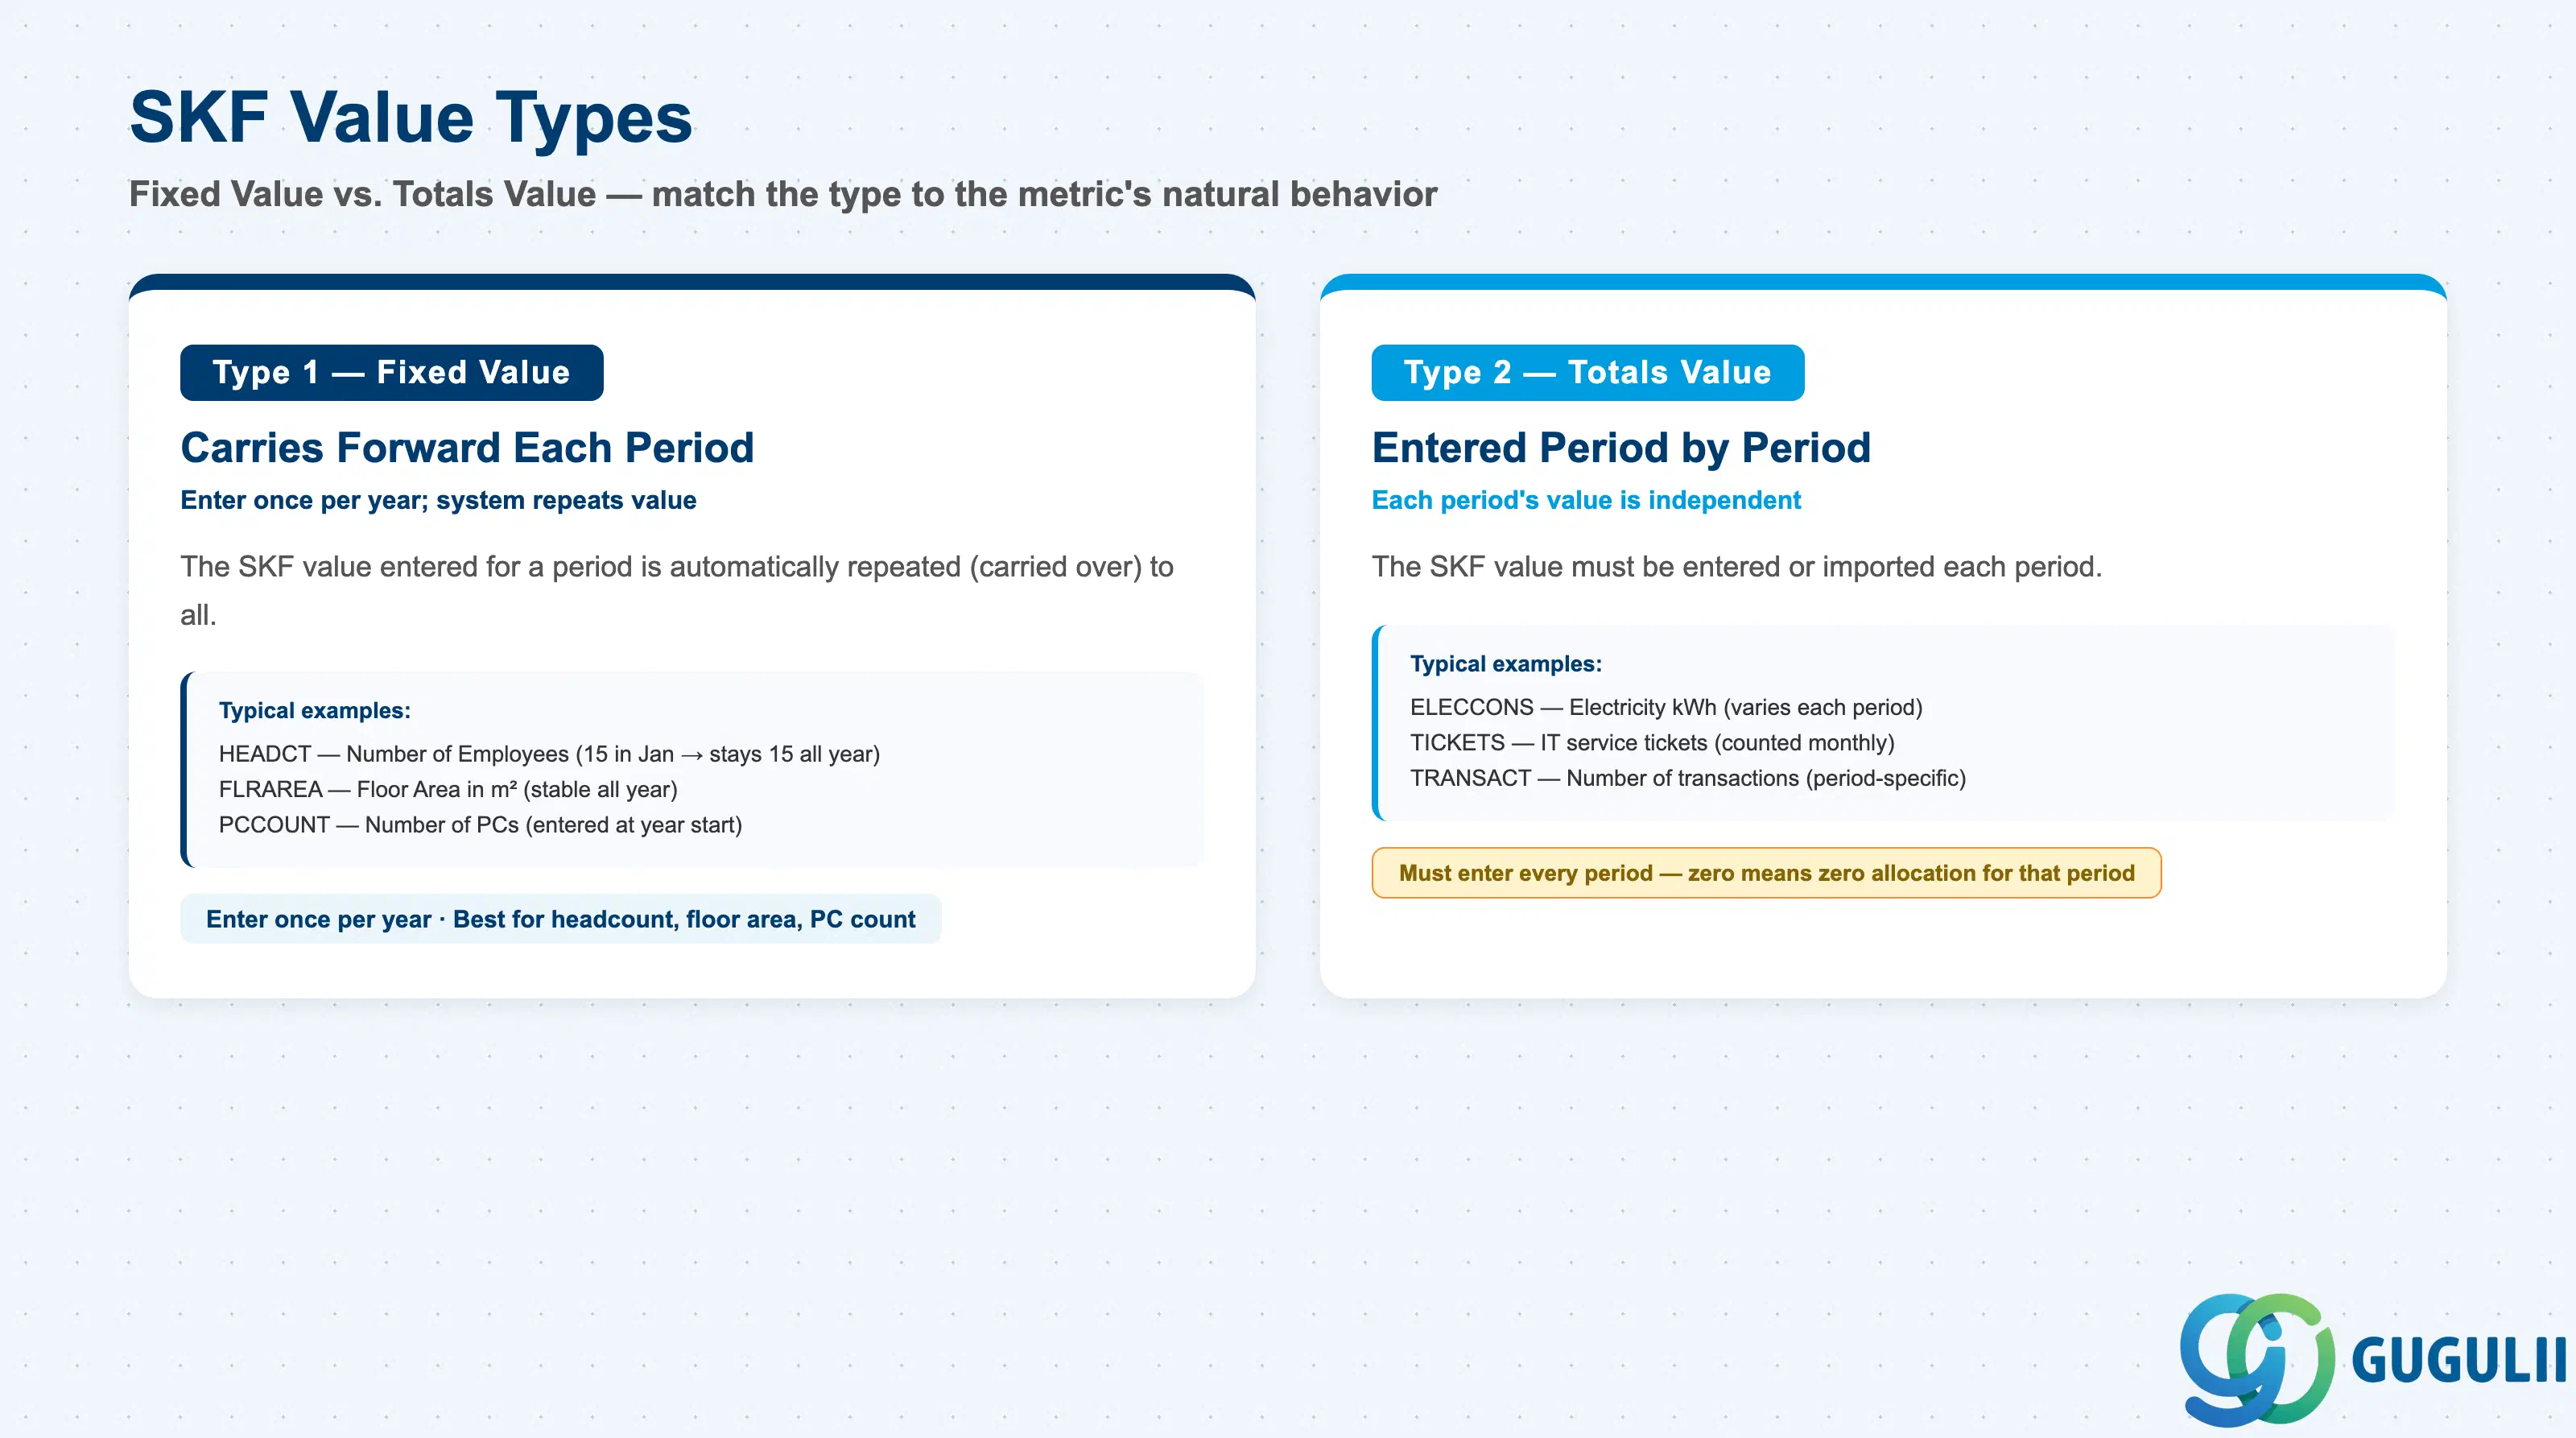
The key design choice for each Statistical Key Figure is whether it should be treated as a fixed value (the same in every period) or a totals value (posted individually each period).
| Value Type | Code | Description | Use Case | Key Behavior |
|---|---|---|---|---|
| Fixed Value | 1 | The SKF value entered for a period is automatically repeated (carried over) to all subsequent periods within the same fiscal year | Headcount, floor area, number of PCs — metrics that are stable across the year | Enter once per year; the system uses the same value for every period. Reduces data entry burden for stable metrics. Changing the value mid-year creates a new entry from the change period forward. |
| Totals Value | 2 | The SKF value is entered period by period — each period’s value is independent | Electricity consumption, number of service tickets, transaction volume — metrics that vary each period | Must be entered or imported each period. Appropriate for consumption-based metrics. Zero periods are possible (no entry = zero distribution for that period). |
Design principle: Match the SKF type to the actual nature of the metric. Use Fixed Value for metrics that change infrequently (headcount, area); use Totals Value for metrics that are measured or collected each period (consumption, transaction counts). Mixing types causes inaccurate cycle allocations — a Fixed Value SKF for electricity appears plausible in months 1–3 and misleading by month 12 when actual consumption has changed.
Statistical Key Figure is scoped at the Controlling Area level — defined once and available to post against any Cost Center in that CO Area. It has no master-data link to any Cost Center; values are posted at transaction time, not maintained as a relationship on either master.
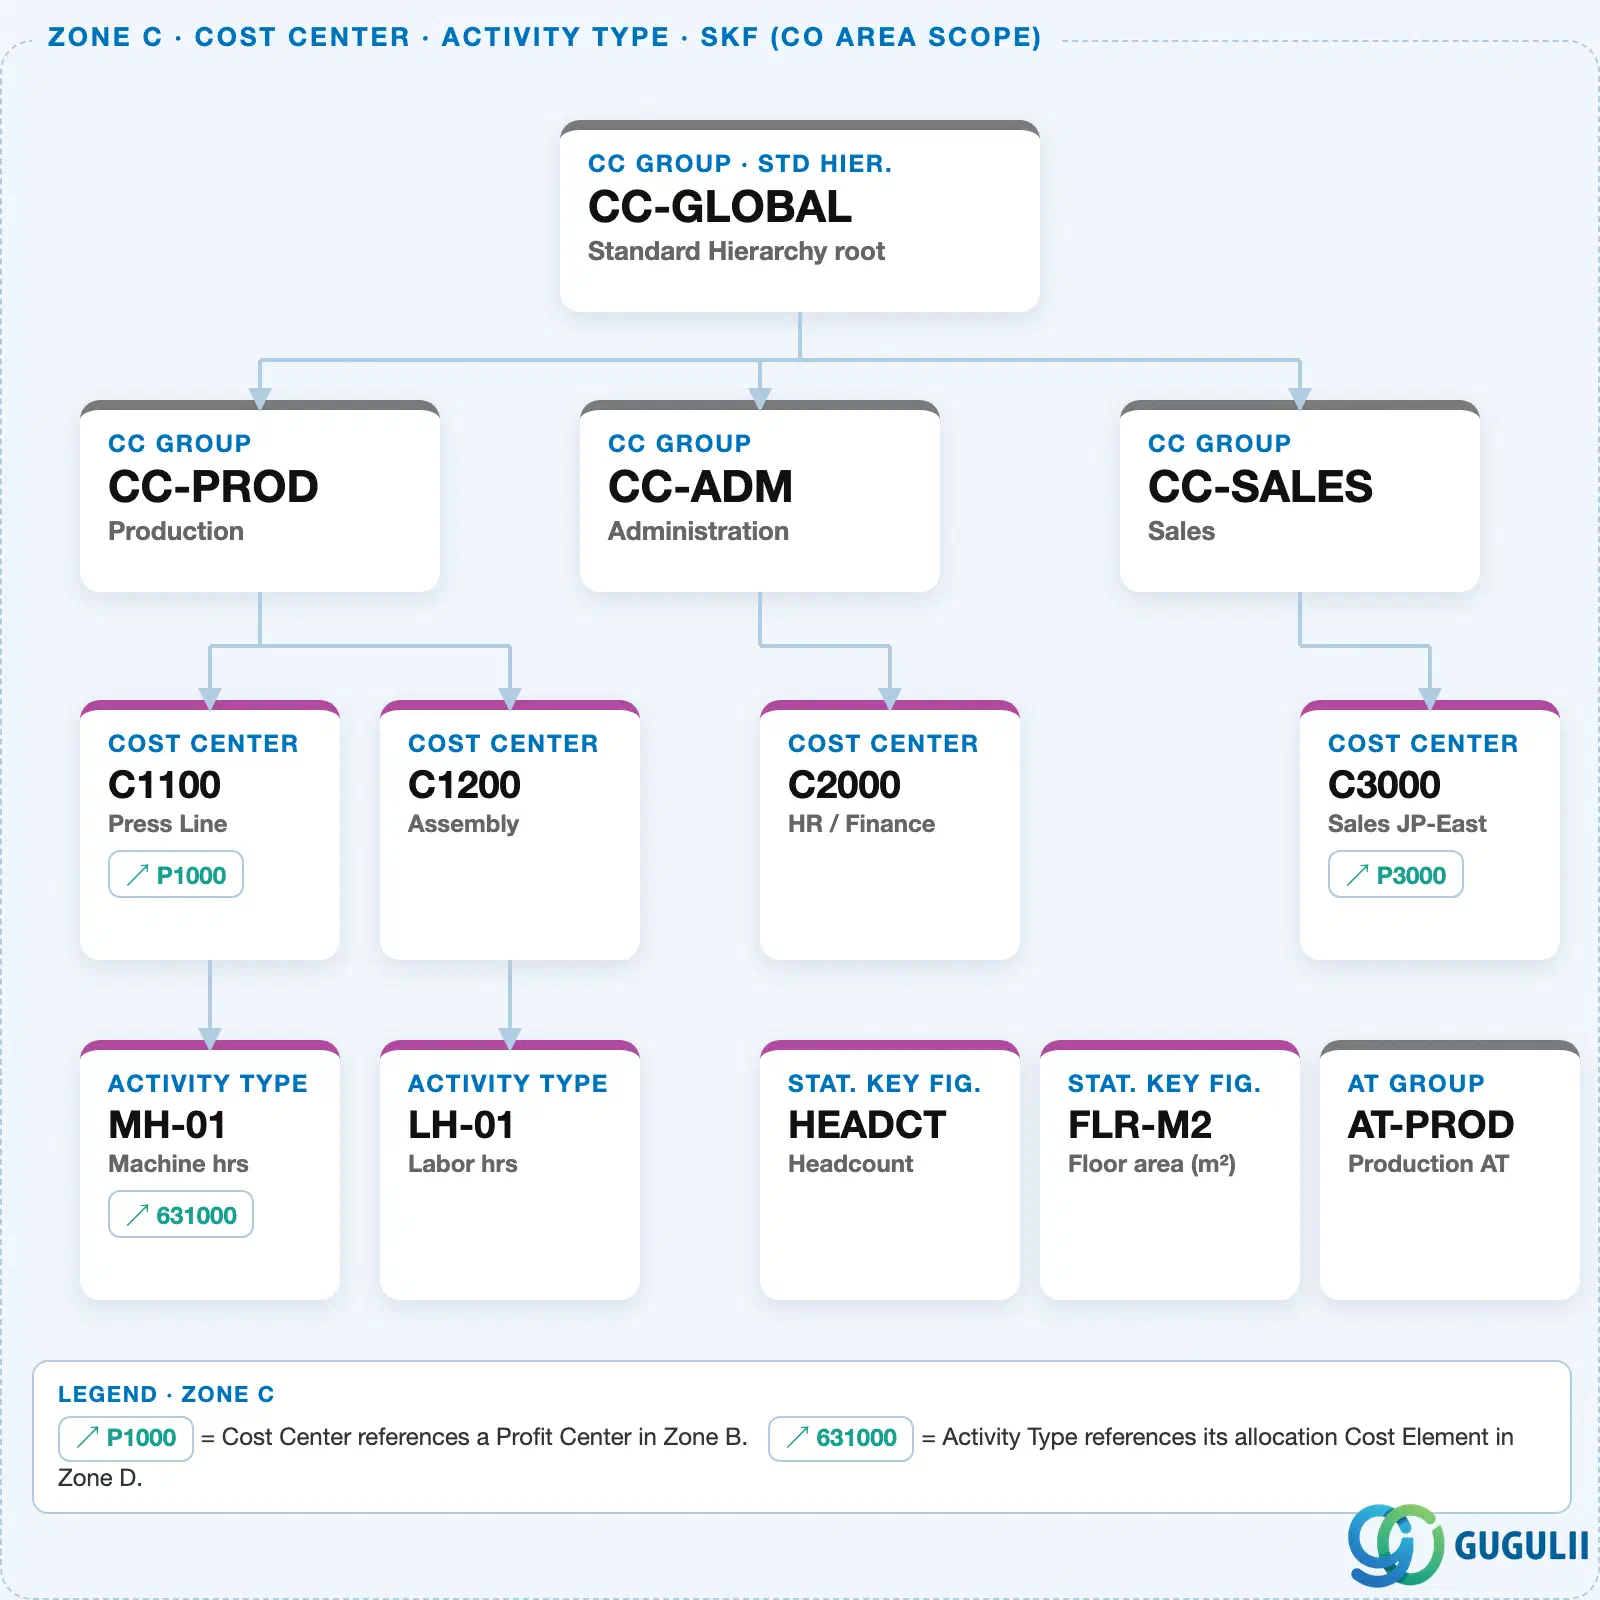
Data hierarchy with a concrete example
Controlling Area 1000
   │
   ├── SKF "HEADCT"    Headcount
   ├── SKF "FLR-M2"     Floor area (m²)
   │
   └── Cost Center "C2000"   HR / Finance
          (HEADCT and FLR-M2 values posted here per period — no master link, transaction-only)
Design principle: Keep the SKF list small — 5 to 15 is typical. Each SKF represents one distinct allocation basis (headcount, floor area, ticket count). More than 20 usually signals the cost-allocation design has grown overly complex; simplify the assessment/distribution cycle design before adding more SKFs.
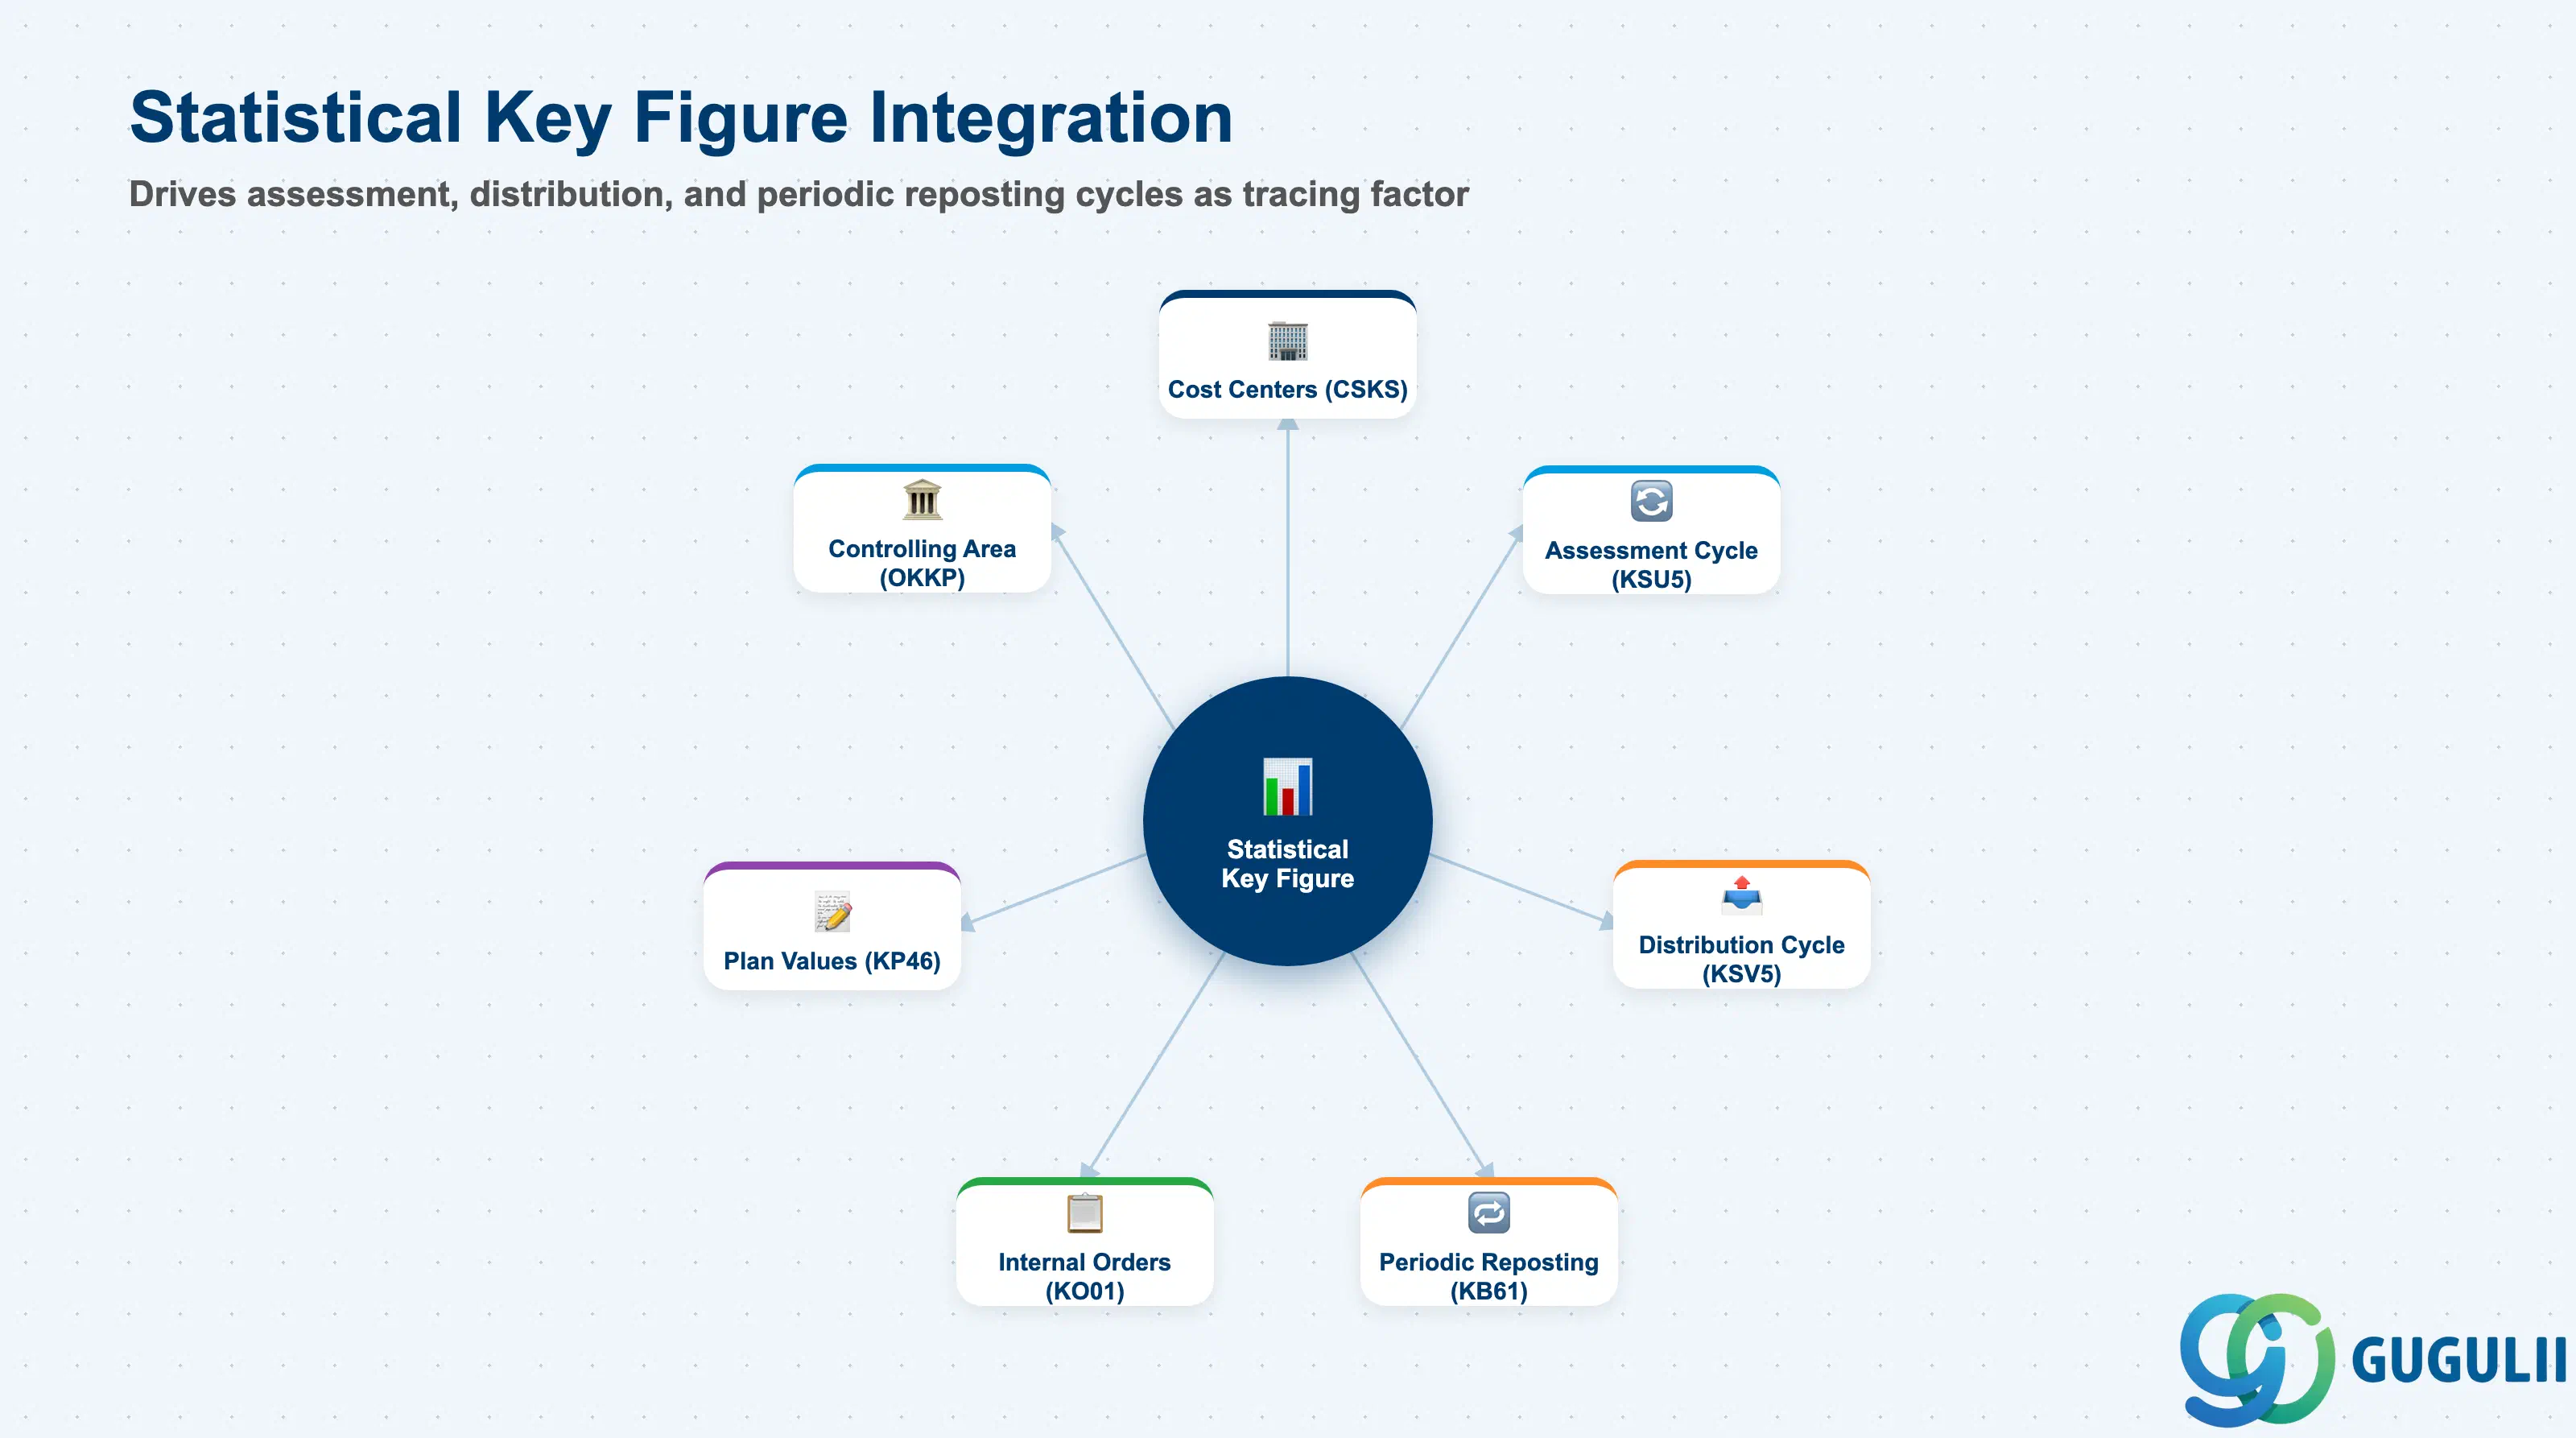
| Object | Relationship | Practical Notes |
|---|---|---|
| Cost Center (KS01) | SKF values are posted per Cost Center | The Cost Center is the primary object for SKF value entry. A single SKF can have values posted to multiple Cost Centers — each value independently serves as the receiver’s share of the distribution. |
| Internal Order (KO01) | SKF values can also be posted to Internal Orders | Less common than Cost Center postings, but used when tracking service consumption at the order level. |
| Assessment Cycle (KSU5) | SKF as the tracing factor for cost distribution | The cycle’s receiver tracing factor references an SKF. At cycle execution, the system reads the current period’s SKF values for each receiver, calculates the percentage share, and allocates the sender’s costs accordingly. When an SKF value is zero for a receiver in the period, that receiver gets no allocation. |
| Distribution Cycle (KSV5) | Same SKF usage as assessment | Distribution cycles use SKF values as the basis for splitting primary cost elements across receivers. |
| Periodic Reposting (KB61) | SKF-based reposting of FI documents to cost objects | A less common but valid use: SKFs can drive periodic reposting of actual FI line items to cost centers (e.g., rent invoice split by floor area). |
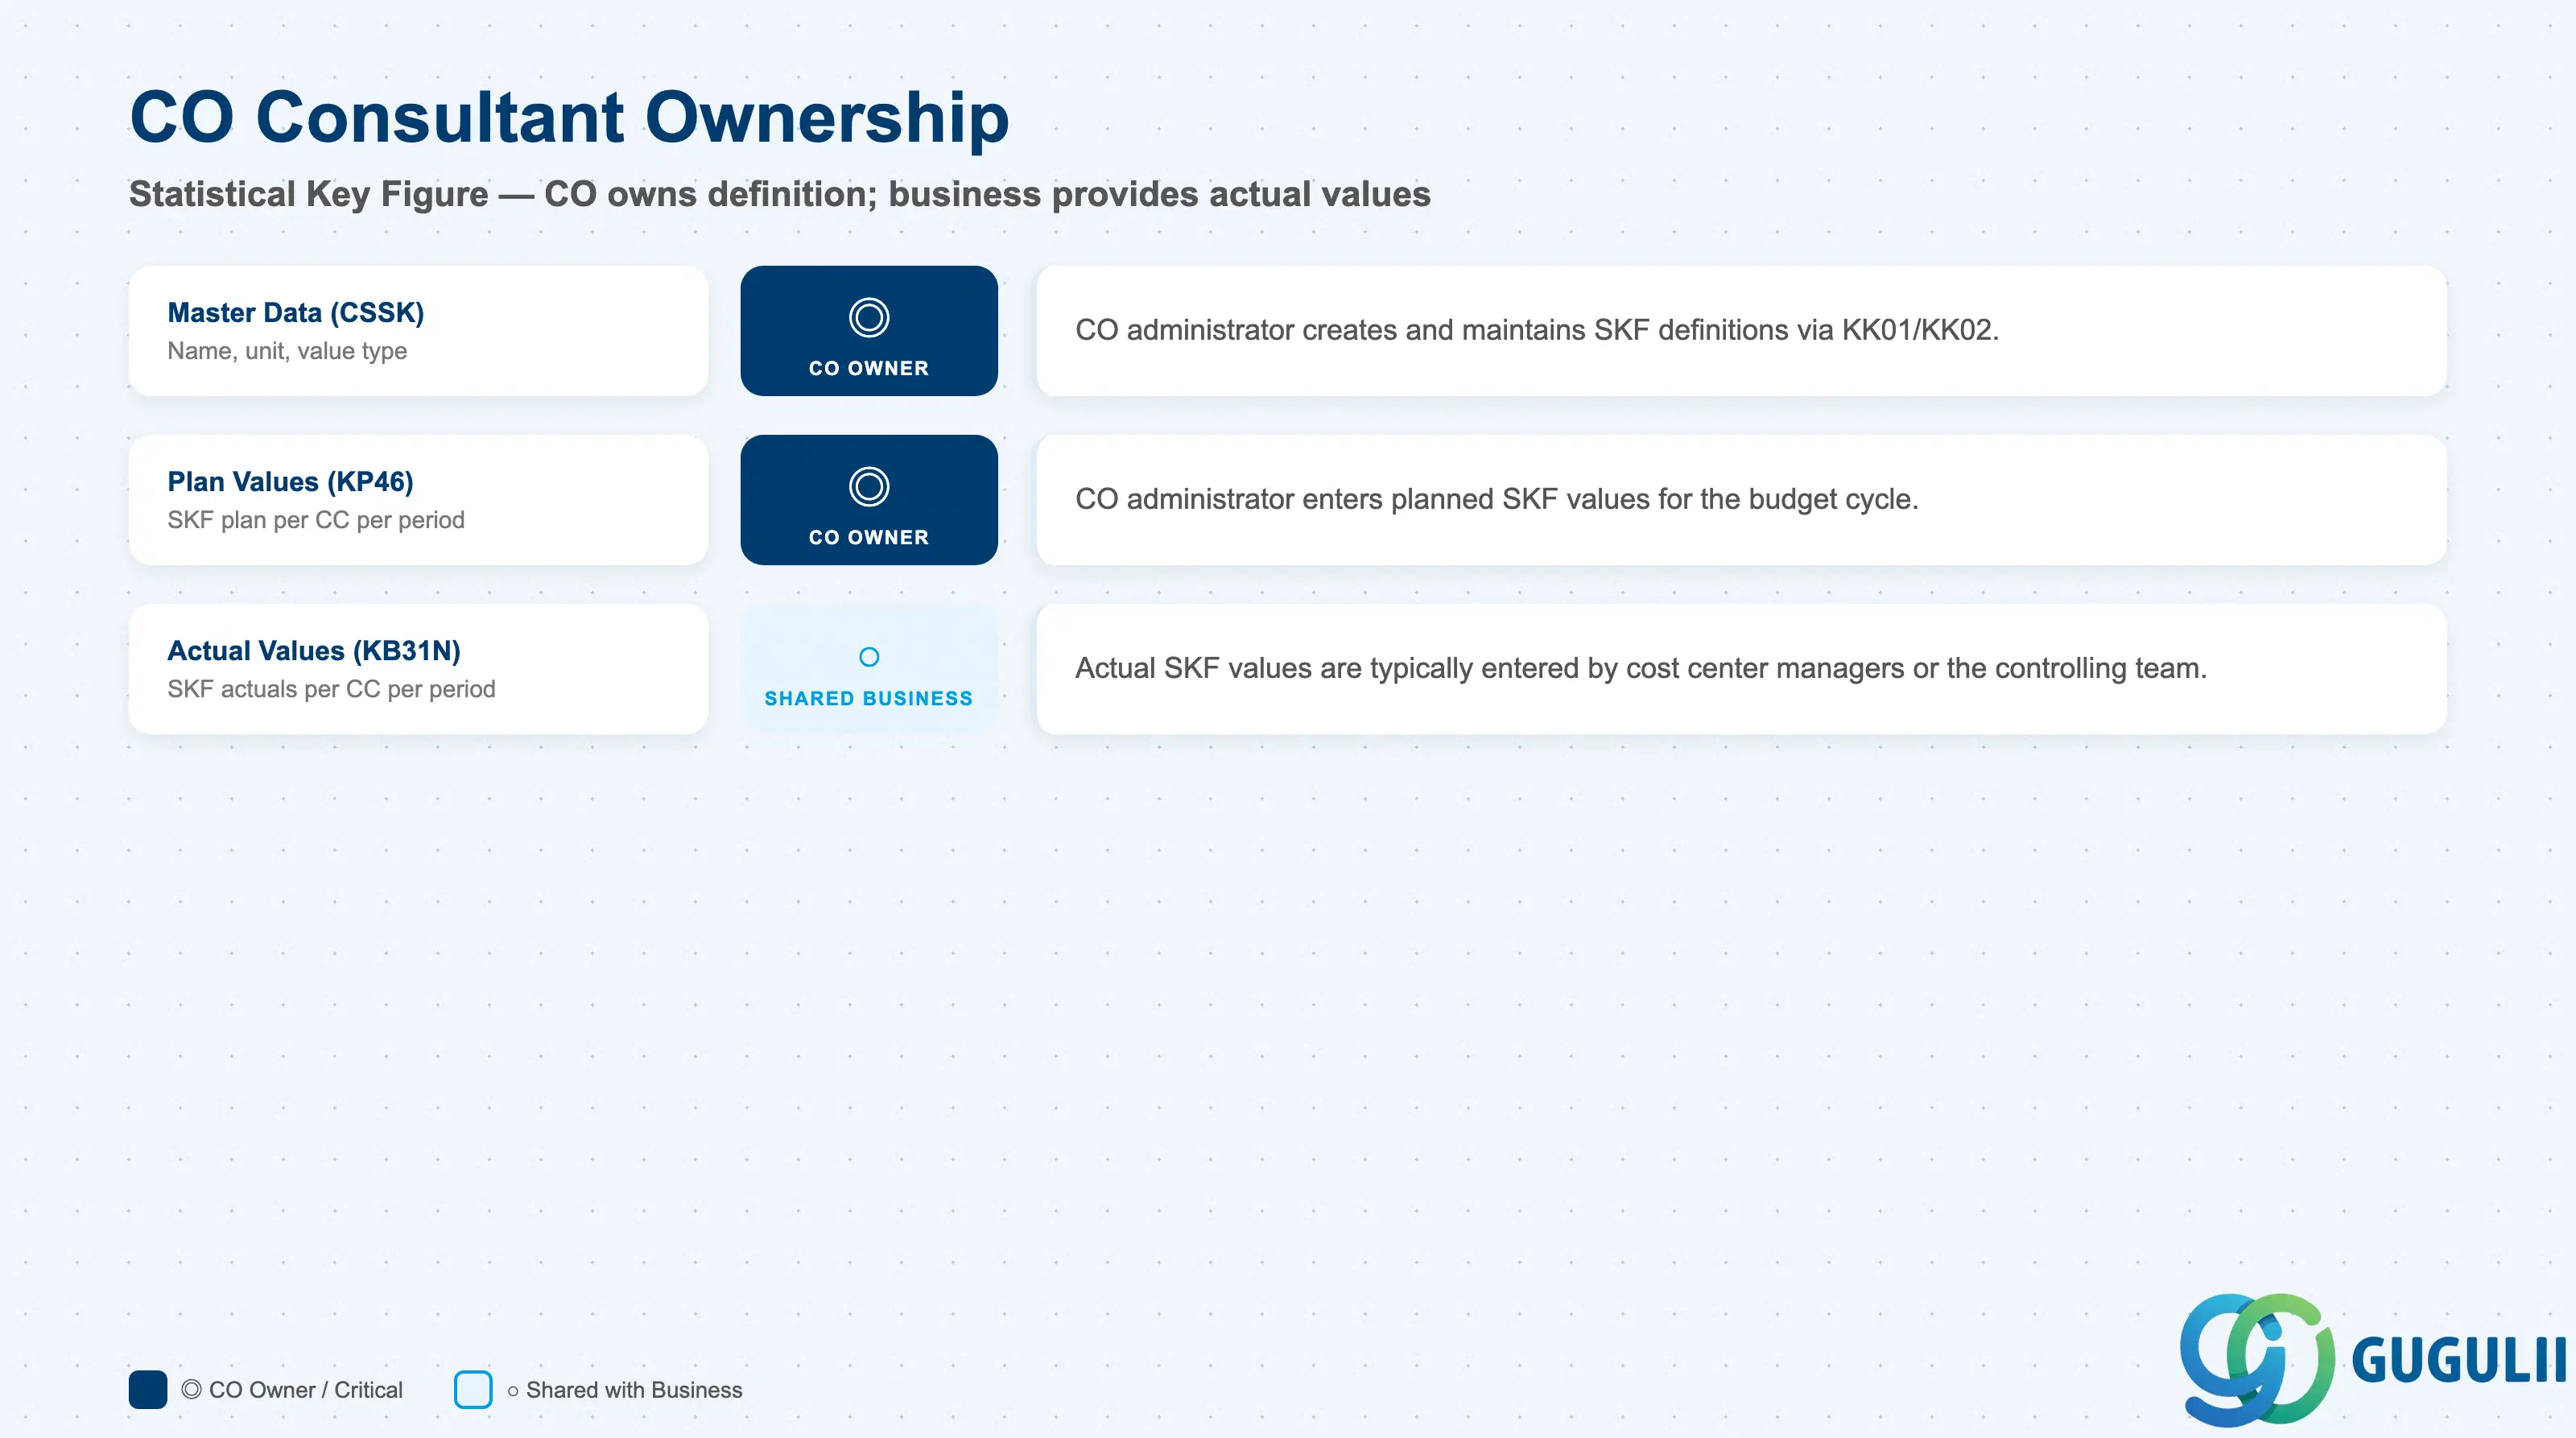
| Data Section | CO Involvement | Notes |
|---|---|---|
| Master Data (CSSK) | ◎ Owner | SKF definition, unit, value type — CO administrator creates and maintains |
| Plan Values (KP46) | ◎ Owner | Planning SKF values per Cost Center per period — CO or cost center manager |
| Actual Values (KB31N) | ○ Shared with business | Actual SKF values are typically entered by cost center managers or controlling team based on operational data provided by HR/Facilities/IT — CO administrator oversees the process |
Legend: ◎ = Owner / Critical, ○ = Direct involvement
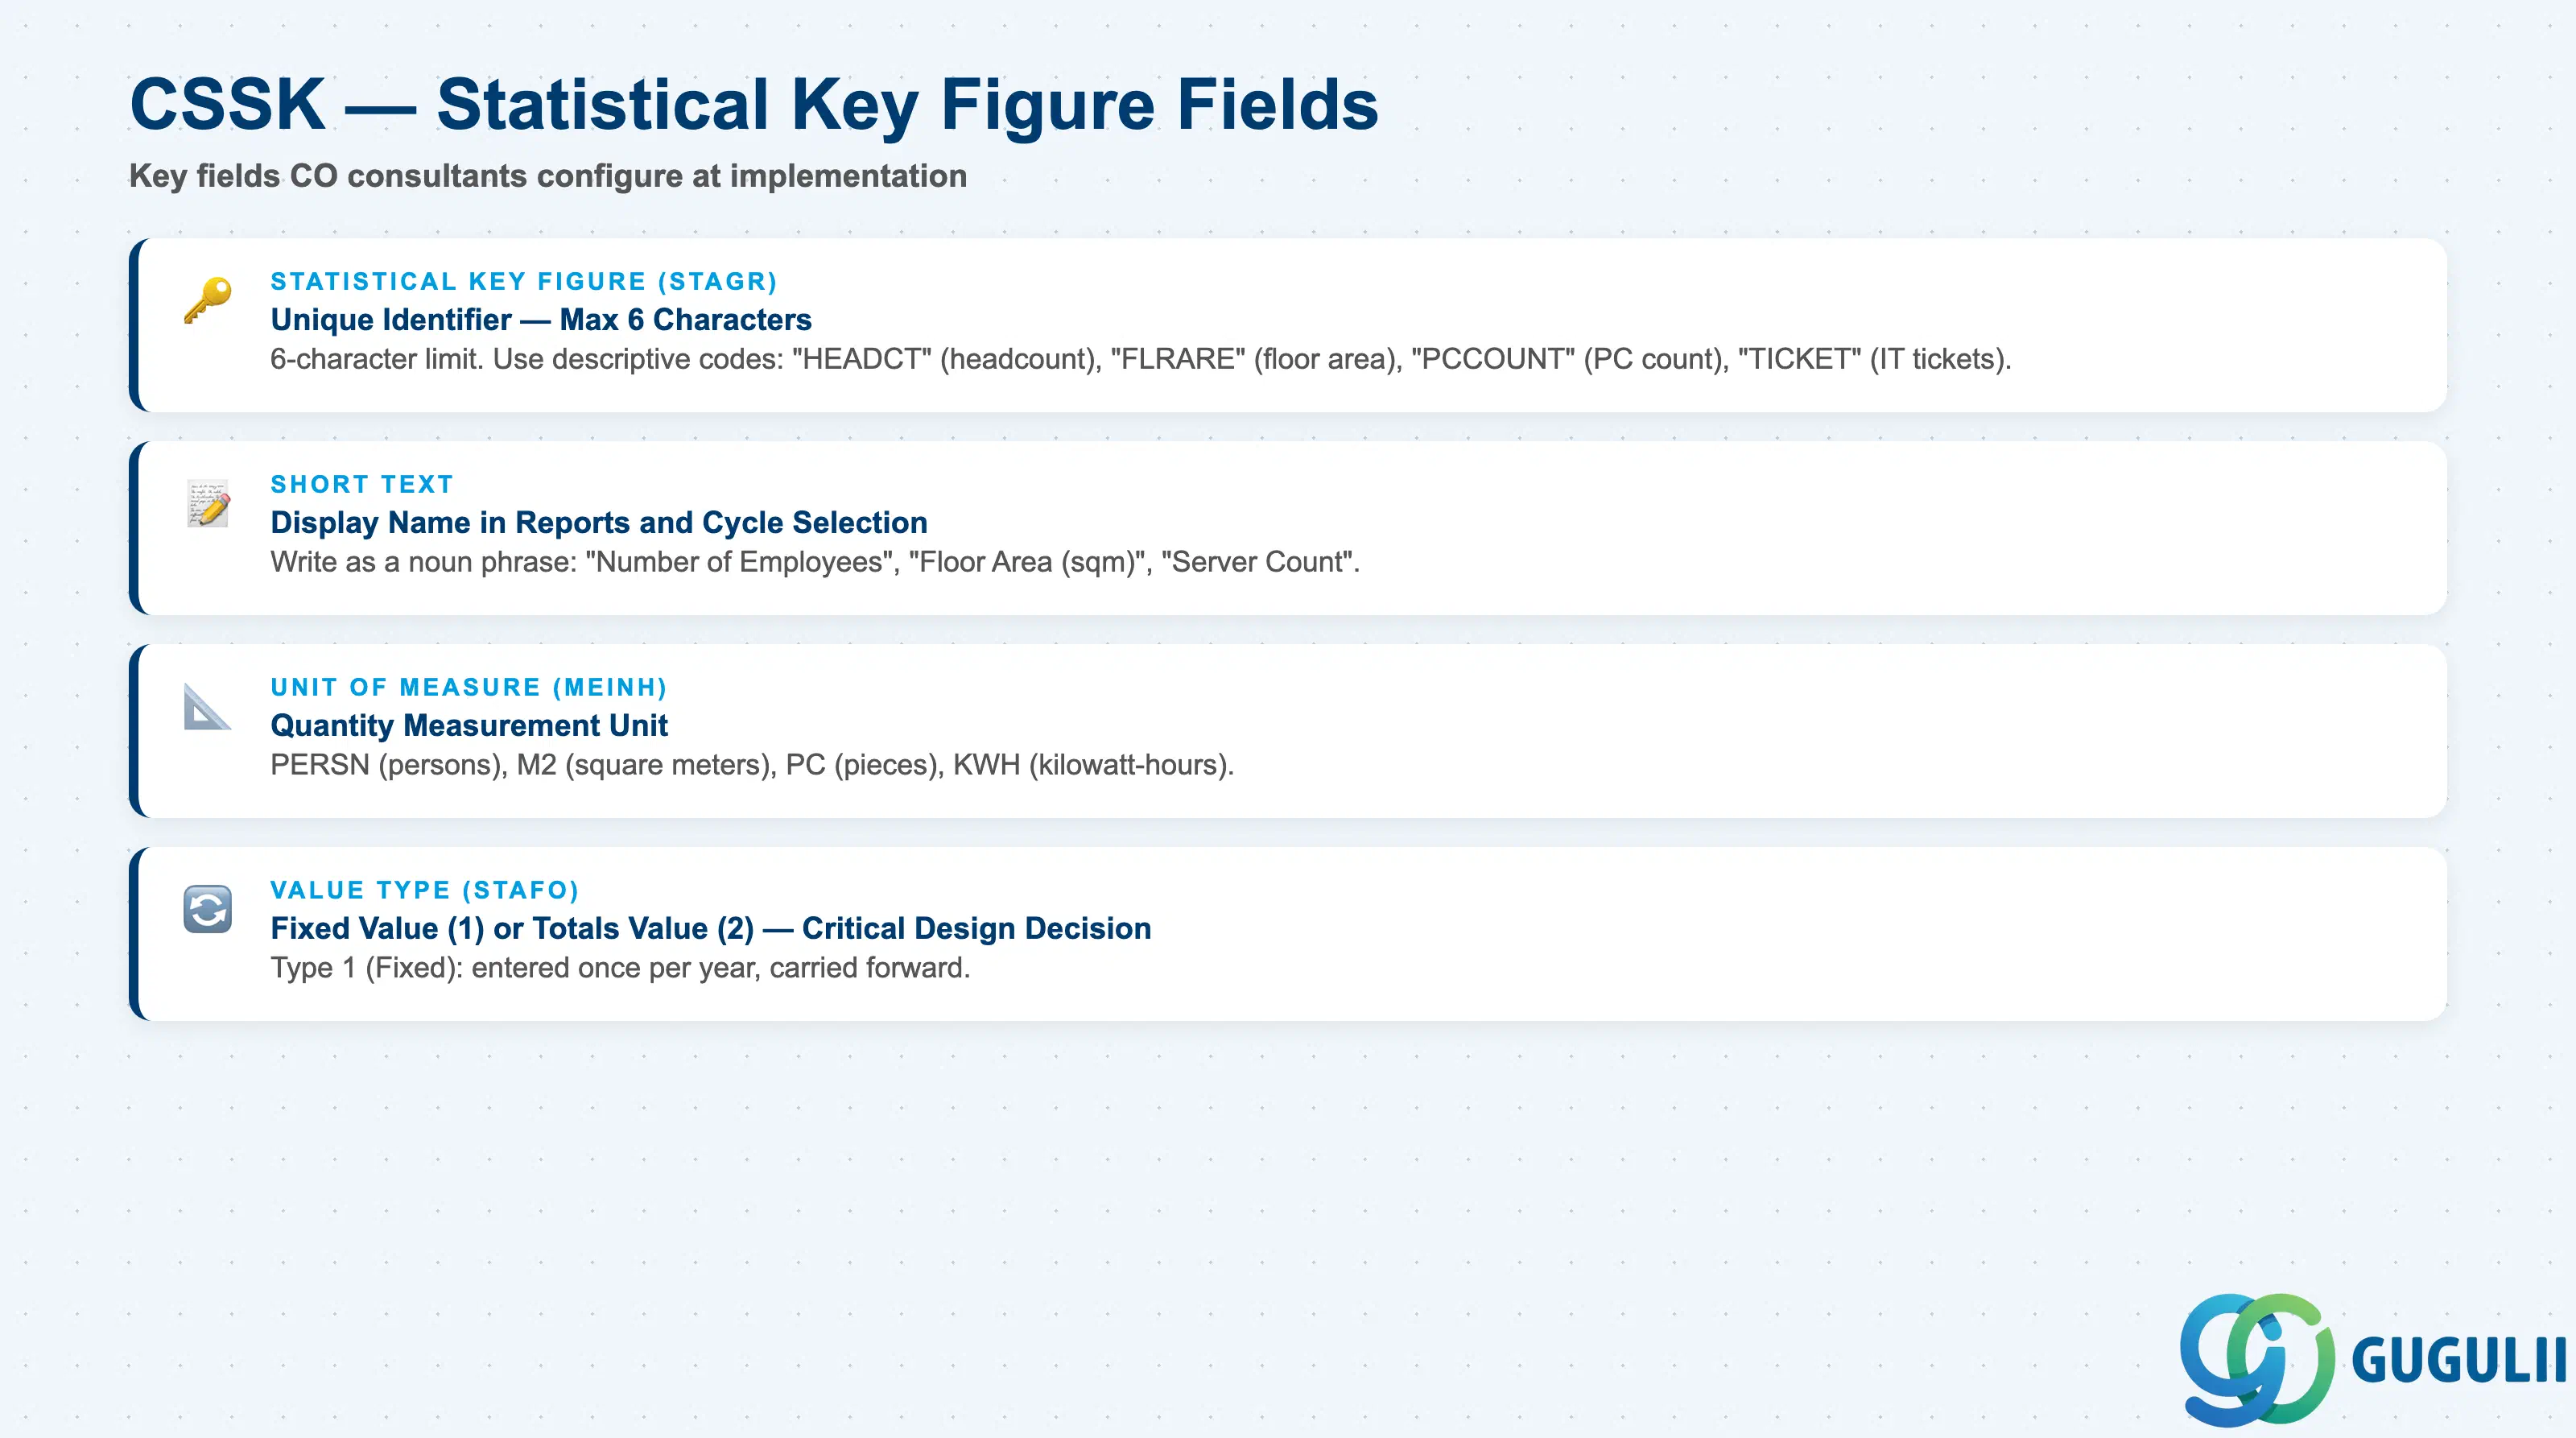
| Field | Description | Practical Usage |
|---|---|---|
| Statistical Key Figure (STAGR) | Unique identifier within the Controlling Area | Maximum 6 characters. Use a descriptive code that reflects the metric: “HEADCT” (headcount), “FLRAREA” (floor area), “PCCOUNT” (PC count). Keep the name short and standardized across all SKFs — CO administrators, cost center managers, and auditors all reference SKF codes in reports and cycle definitions. Avoid abbreviations that are meaningful only to the implementation team. |
| Short Text | Display name in reports | The text that appears in report column headers and cycle selection dialogs. Write it as a noun phrase describing the metric: “Number of Employees”, “Floor Area (sqm)”, “Server Count”. Used by cycle administrators when selecting the tracing factor — clarity here reduces configuration errors. |
| Unit of Measure (MEINH) | The unit of the quantity metric | Examples: PERSN (persons), M2 (square meters), PC (pieces/count), KWH (kilowatt-hours). The unit is displayed in reports and in the KB31N entry screen. Ensure the unit matches the data source used to fill the SKF values (HR headcount extract, facilities floor plan, IT asset list). |
| Value Type (STAFO) | Fixed Value (1) or Totals Value (2) | This is the critical field that determines the entry and carry-forward behavior. See Section 1.2 for detailed guidance. Confirm during blueprint — changing the Value Type after SKF values have been posted requires clearing the existing values and re-posting with the new type, which is operationally disruptive. |
| ID | Category | Title |
|---|---|---|
| co-001 | Overview | What is SAP CO? |
| ID | Category | Title |
|---|---|---|
| co-a01 | Overview | SAP CO Master Data: Overview, Hierarchy & Relationships |
| co-a02-01 | Master Data | SAP CO Material Master |
| co-a03-01 | Master Data | SAP CO Cost Element |
| co-a03-02 | Master Data | SAP CO Cost Element Group |
| co-a04-01 | Master Data | SAP CO Profit Center Group |
| co-a04-02 | Master Data | SAP CO Profit Center |
| co-a05-01 | Master Data | SAP CO Cost Center Group |
| co-a05-02 | Master Data | SAP CO Cost Center |
| co-a05-03 | Master Data | SAP CO Activity Type Group |
| co-a05-04 | Master Data | SAP CO Activity Type |
| co-a05-05 | Master Data | SAP CO Statistical Key Figure 📍 |
| co-a06-01 | Master Data | SAP CO Internal Order Group |
| co-a06-02 | Master Data | SAP CO Internal Order |
| co-a07-01 | Master Data | SAP CO Cost Component Structure |
| co-a07-02 | Master Data | SAP CO Costing Variant |
| co-a08-01 | Master Data | SAP CO Operating Concern |
| ID | Category | Title |
|---|---|---|
| co-b01 | Overview | SAP CO Transactions: Process Flow, Hierarchy & Relationships |