Title here
Summary here

A Key Figure is the SAP IBP object type that represents a single quantitative measure flowing through a Planning Area — demand quantity, supply quantity, inventory quantity, revenue, forecast accuracy, fill rate, and similar values. It is the “value” axis of the planning data cube, complementing the master-data-driven dimension axes (Product, Location, Customer, Time) covered in the Phase 1 master data articles. Unlike Product, Location, or Customer Master, a Key Figure is not typically replicated from an ERP master record — it is defined as part of building the Planning Area’s model itself. This article covers what a Key Figure is, its core Stored-vs-Calculated data model, its position in the org/data hierarchy, and every field a consultant configures when creating one.
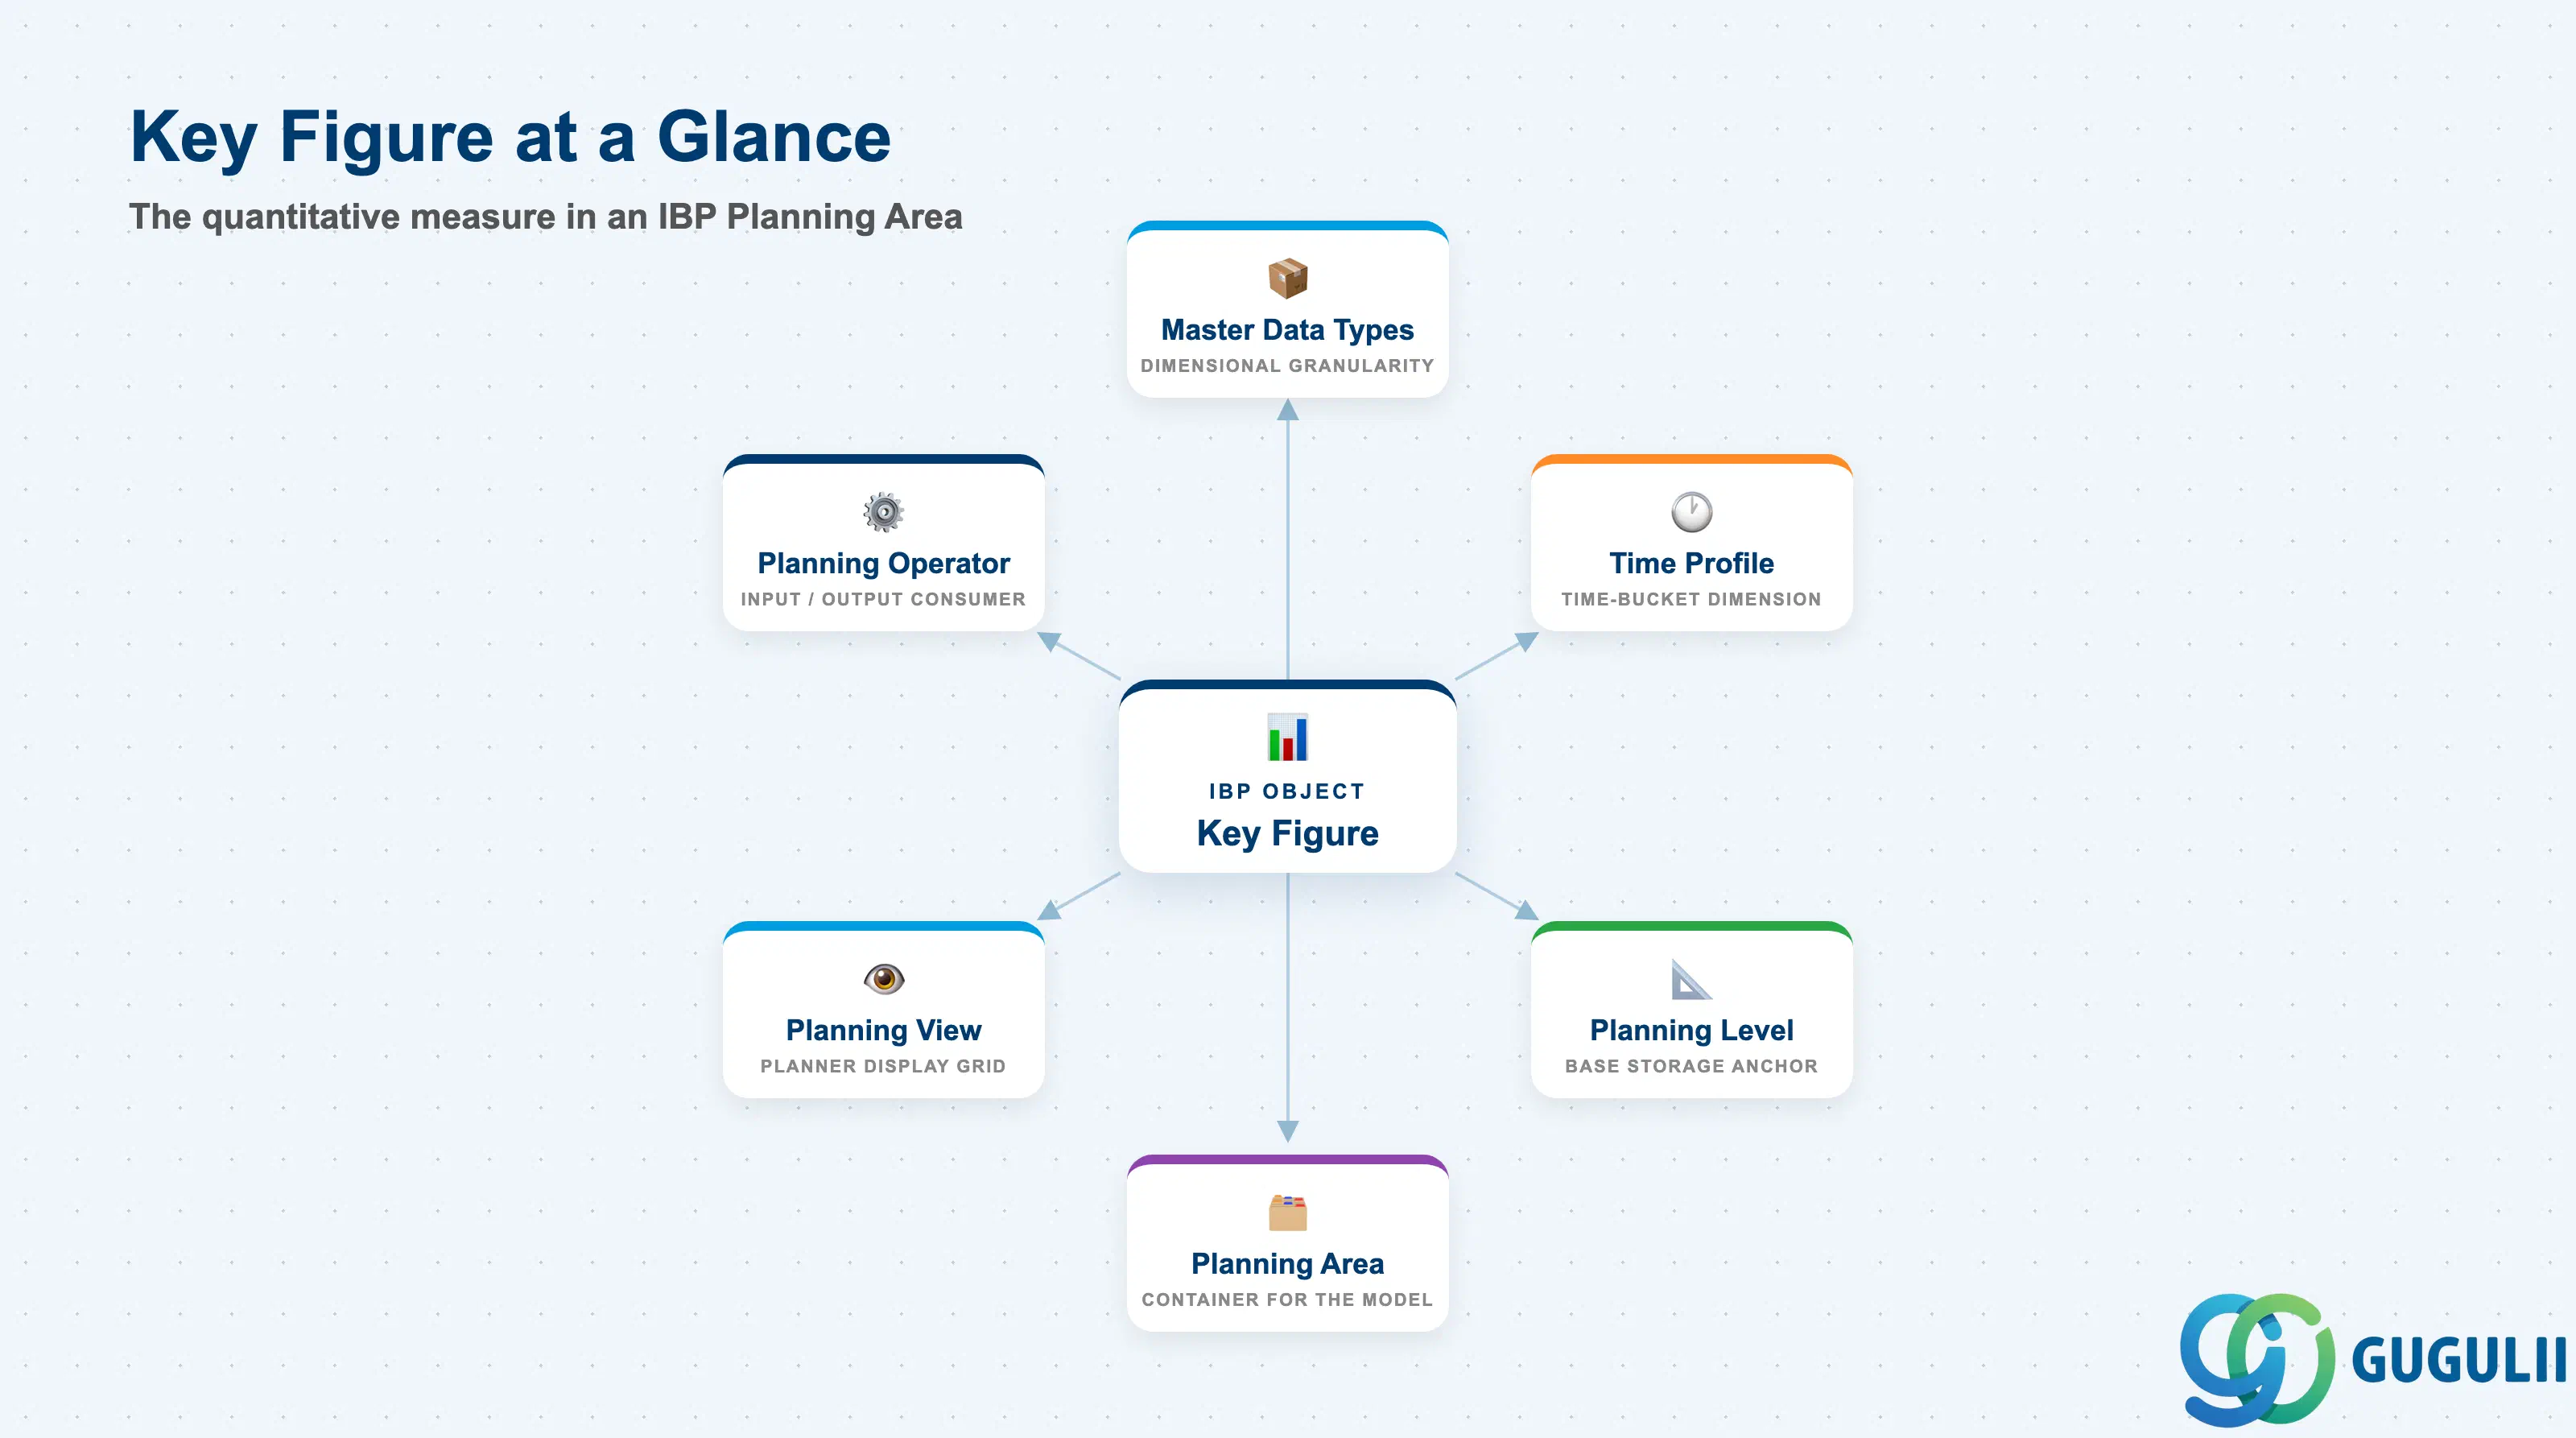
A Key Figure holds the transactional/planning data in an SAP IBP model — quantities and currency amounts representing plan data (sales forecast, projected inventory, capacity plan) or actual/historical data (sales orders, shipment history). It is defined and configured inside a Planning Area, not maintained as an independent, freestanding master data object the way Product or Location Master are.
| Aspect | Details |
|---|---|
| Role | Represents a single quantitative measure (demand qty, supply qty, inventory qty, revenue, KPI) that flows through a Planning Area’s data model |
| Planning processes using it | Demand Planning, Supply Planning, Inventory Planning, S&OP, and Planning Operators (statistical forecast, supply heuristic, inventory optimizer) all read and write Key Figures |
| Where it’s configured | Planning Area → Configuration tab → Key Figures node → New → Key Figure — a configuration step scoped to a specific Planning Area, not a fully separate standalone master-data app |
| Data storage model | HANA in-memory, scoped to the owning Planning Area; a Key Figure is a stored or calculated measure in that Planning Area’s fact model, not an independently addressable ABAP Dictionary table |
| Governance app | Where-Used Information for Key Figures (Fiori) — shows every calculation, Copy Operator, and Excel Planning Template that references a given key figure |
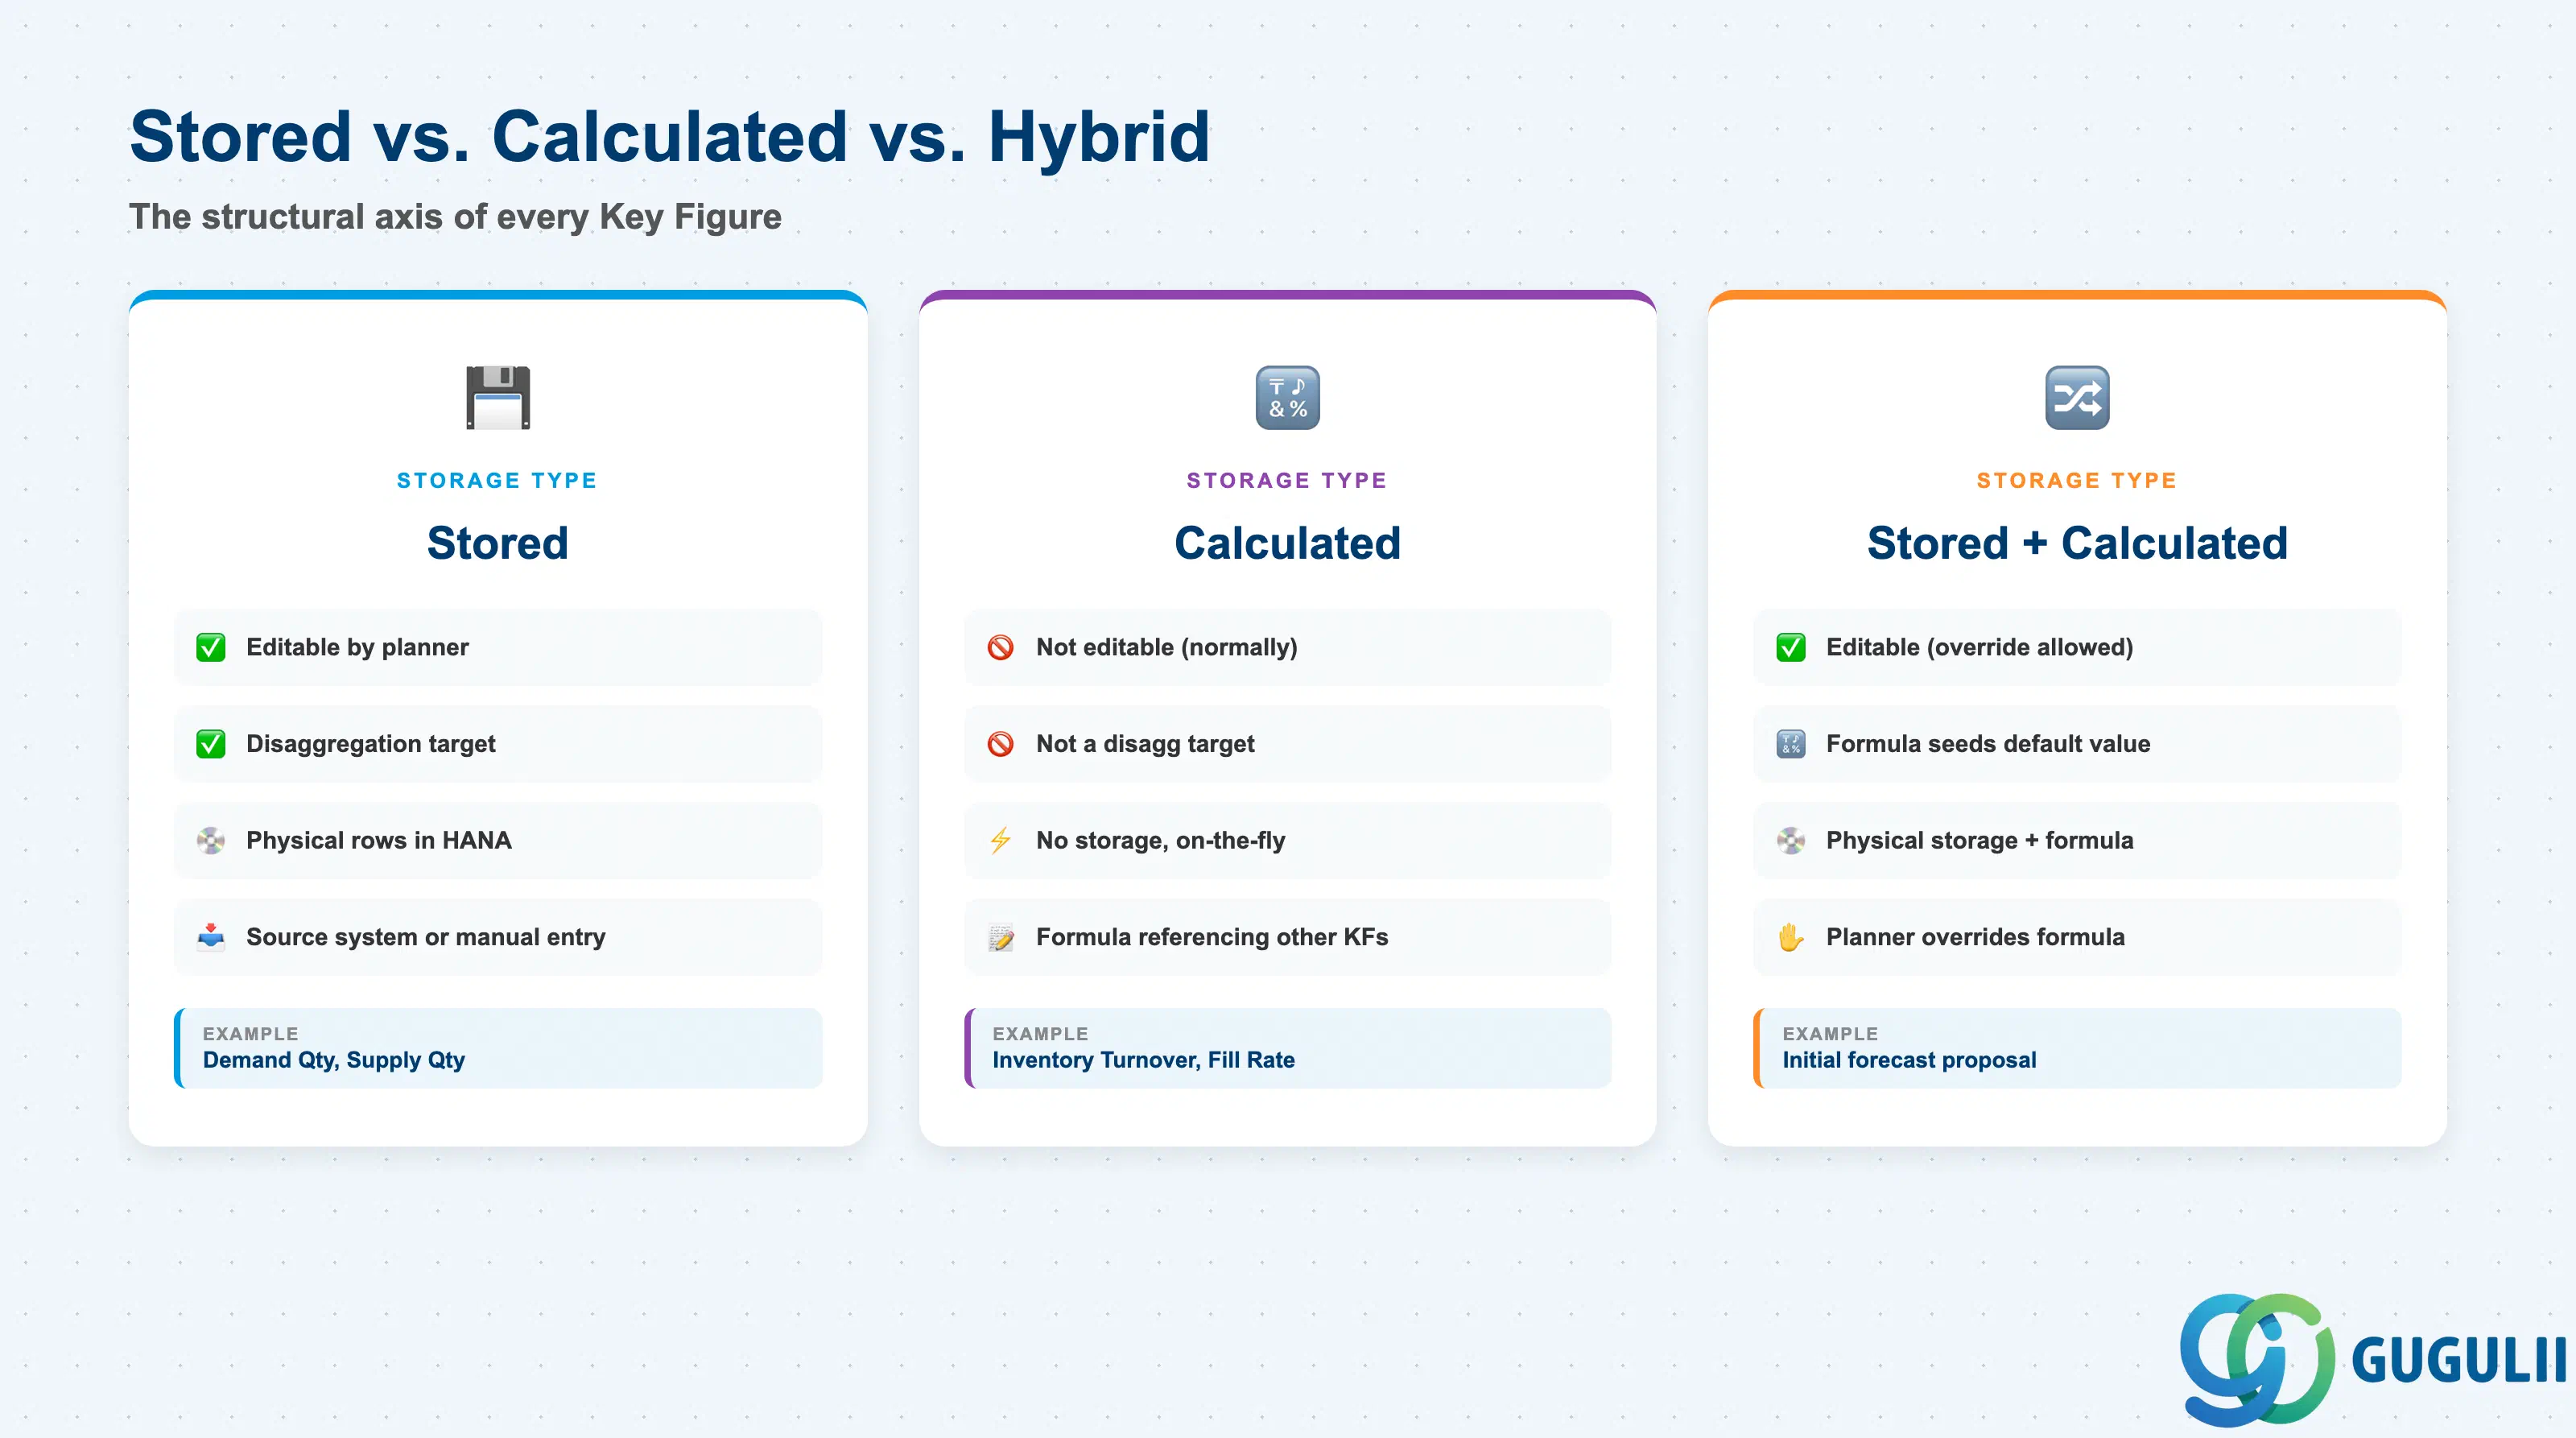
Every Key Figure is built on one structural axis: whether its data is physically stored, or computed at run time. Getting this distinction wrong is costly — it determines whether the figure can be manually edited by a planner and whether it can ever be used as a disaggregation target.
| Storage Type | Editable? | Use Case | Key Behavior |
|---|---|---|---|
| Stored | Yes | Directly integrated from a source system or manually entered by a planner — e.g. Demand Qty, Supply Qty | Physically holds rows at its base planning level. Only a Stored key figure can be set Edit Allowed = Yes. Only a Stored (time-series) key figure can be used as a disaggregation target. |
| Calculated | No (normally) | Derived at run time from a formula referencing other key figures and/or master data attributes — e.g. Inventory Turnover Ratio, Fill Rate | No independent storage — recalculated on every read. Normally cannot be edited directly, since there is nothing to write a manual override back to. |
| Stored + Calculated (hybrid) | Yes (exception) | A formula seeds a default value that a planner can then manually override — e.g. an initial forecast proposal a demand planner adjusts | Special case: flagged as both Stored and Calculated simultaneously so the field becomes editable despite carrying a calculation formula. |
Design principle: Stored vs. Calculated is the structural axis — it determines whether the key figure’s data physically exists in the Planning Area’s storage, which in turn decides whether it can be edited or used as a disaggregation target. Input and Output are a separate, secondary framing layered on top: usage-role labels describing how a key figure is used in a given planning step (a planner-editable input vs. a system-generated result), not a third and fourth storage type sitting beside Stored and Calculated. A Stored key figure is typically the “Input” to a planning step; a Calculated key figure — or the result a Planning Operator writes back — is typically the “Output.” See Section 2.5 for where this usage-role framing becomes an explicit configuration setting on a Planning Operator.
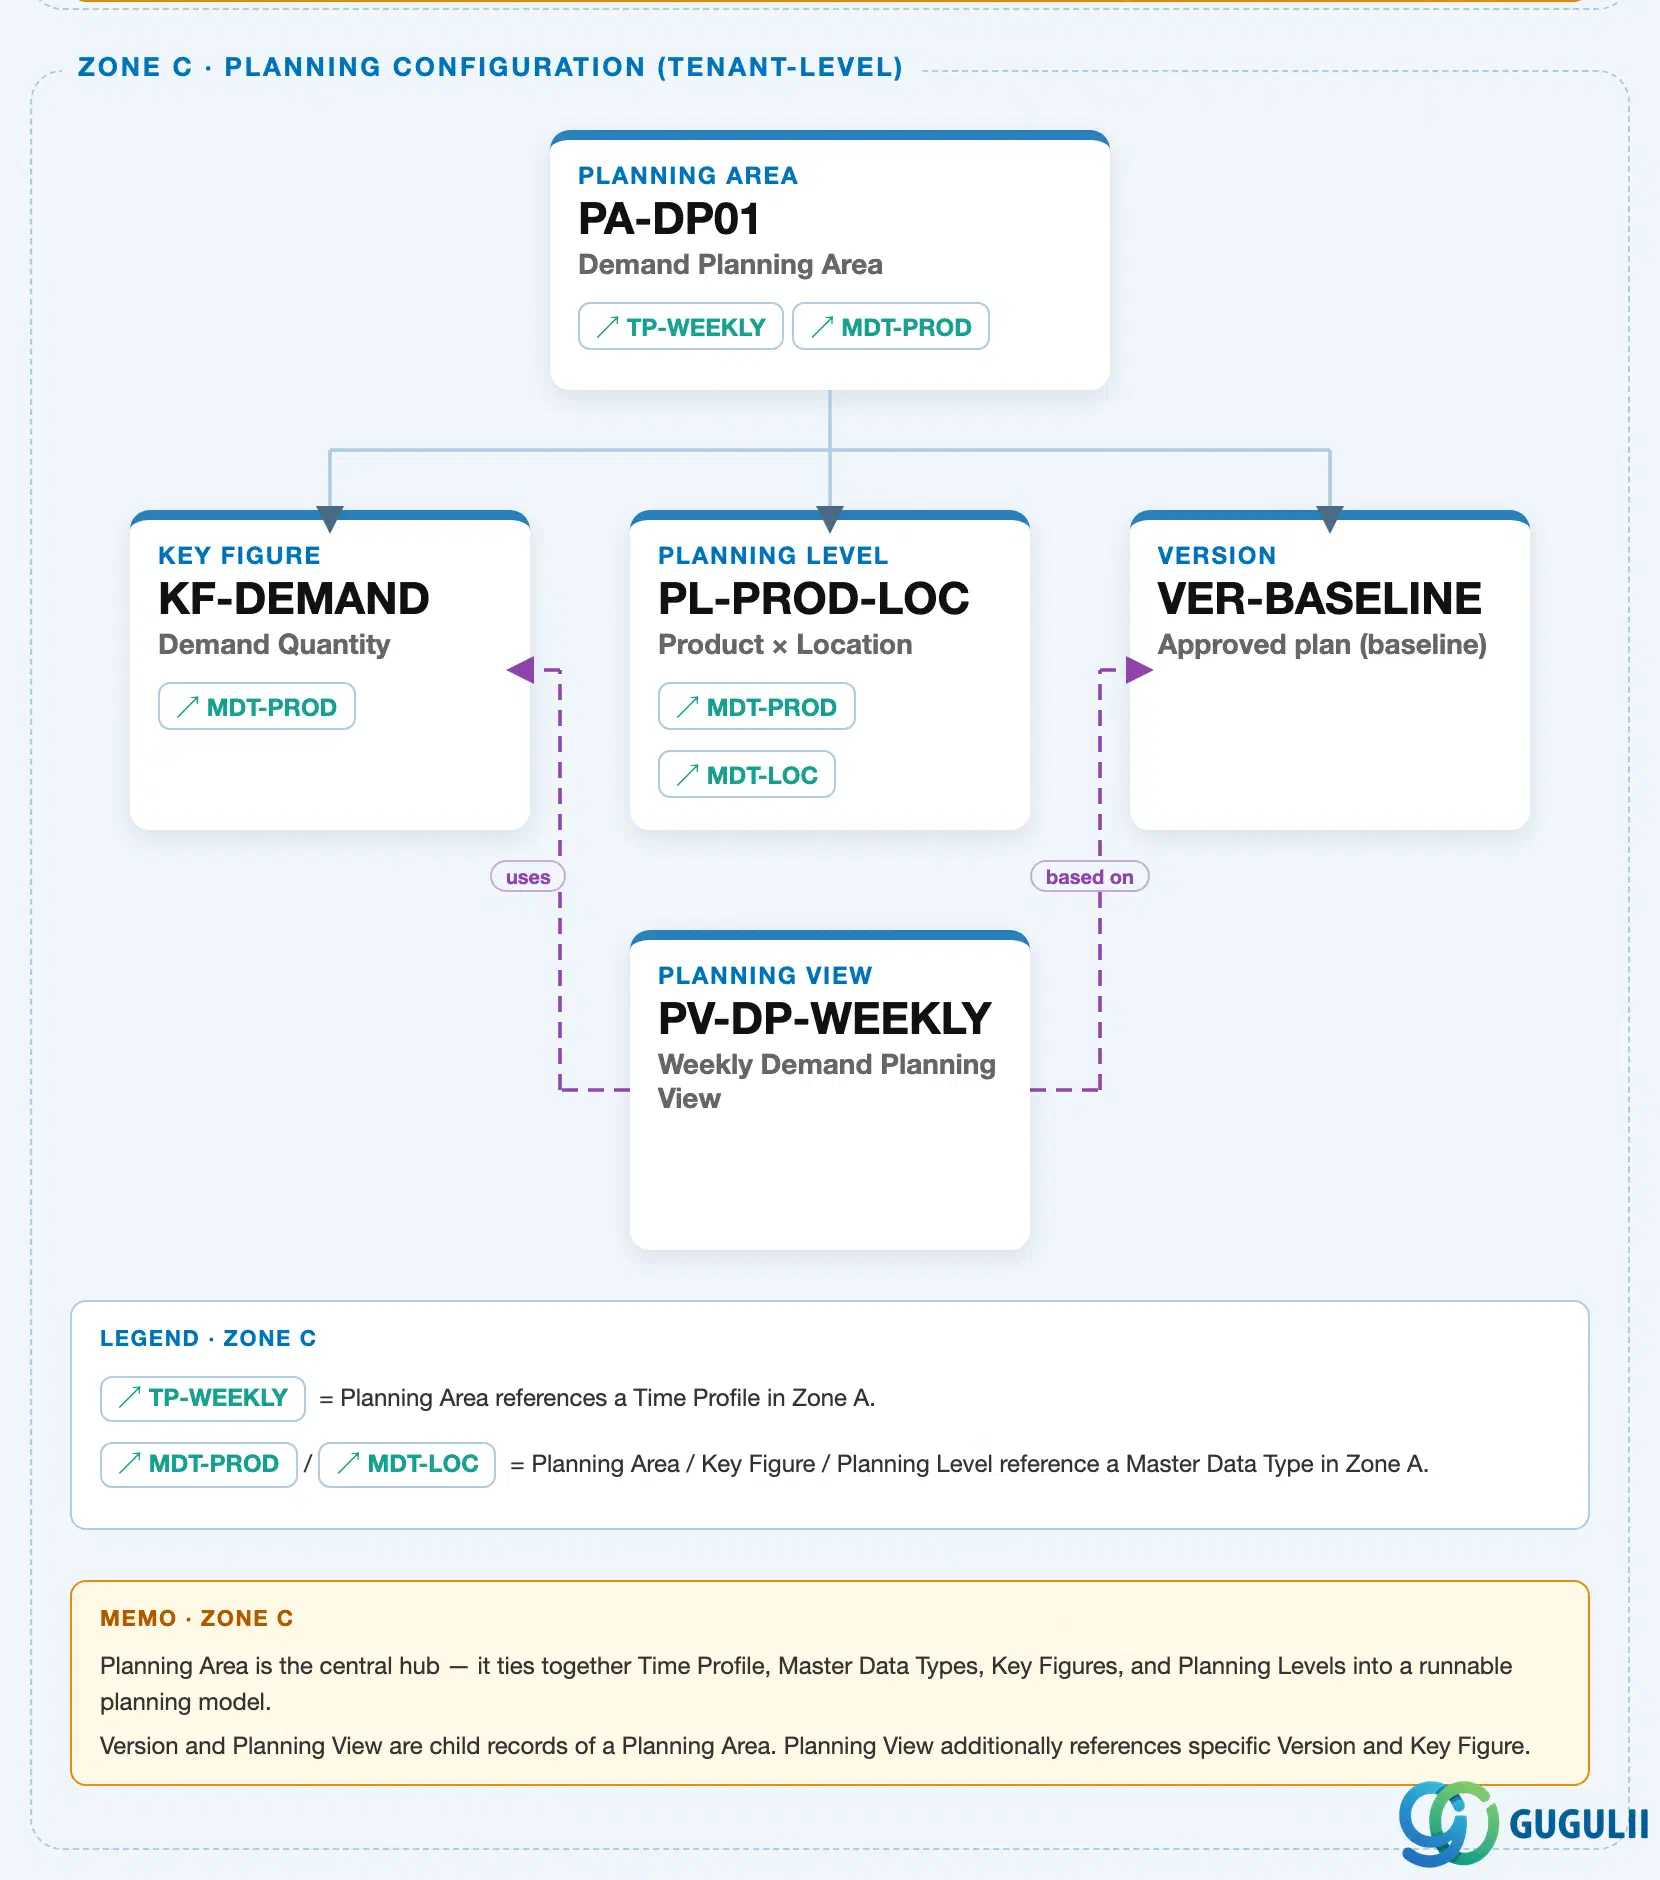
Data hierarchy with a concrete example
Client (SAP IBP Tenant)
   │
   └── Planning Area "PA-DP01" — Demand Planning Planning Area          (IBP-A03-03)
          │
          ├── Key Figure "KF-DEMAND" — Demand Quantity                    [this article's object]
          │
          ├── Planning Level "PL-PROD-LOC" — Product x Location            (IBP-A03-02)
          │
          ├── Version "VER-BASELINE" — Approved plan (baseline)            (IBP-A03-04)
          │
          └── Planning View "PV-DP-WEEKLY" — Weekly Demand Planning View   (IBP-A03-05)
Design principle: Key Figure, Planning Level, and Version are structurally parallel children of a Planning Area — none nests inside another. A Key Figure is anchored to exactly one base planning level; every other level it is viewed or planned at is either aggregated up or disaggregated down from that anchor. The full mechanics of what a Planning Level is and how it is built are covered in sibling article IBP-A03-02; this article treats “base planning level” only as the anchor point a Key Figure’s Storage Type and Aggregation/Disaggregation settings key off of.
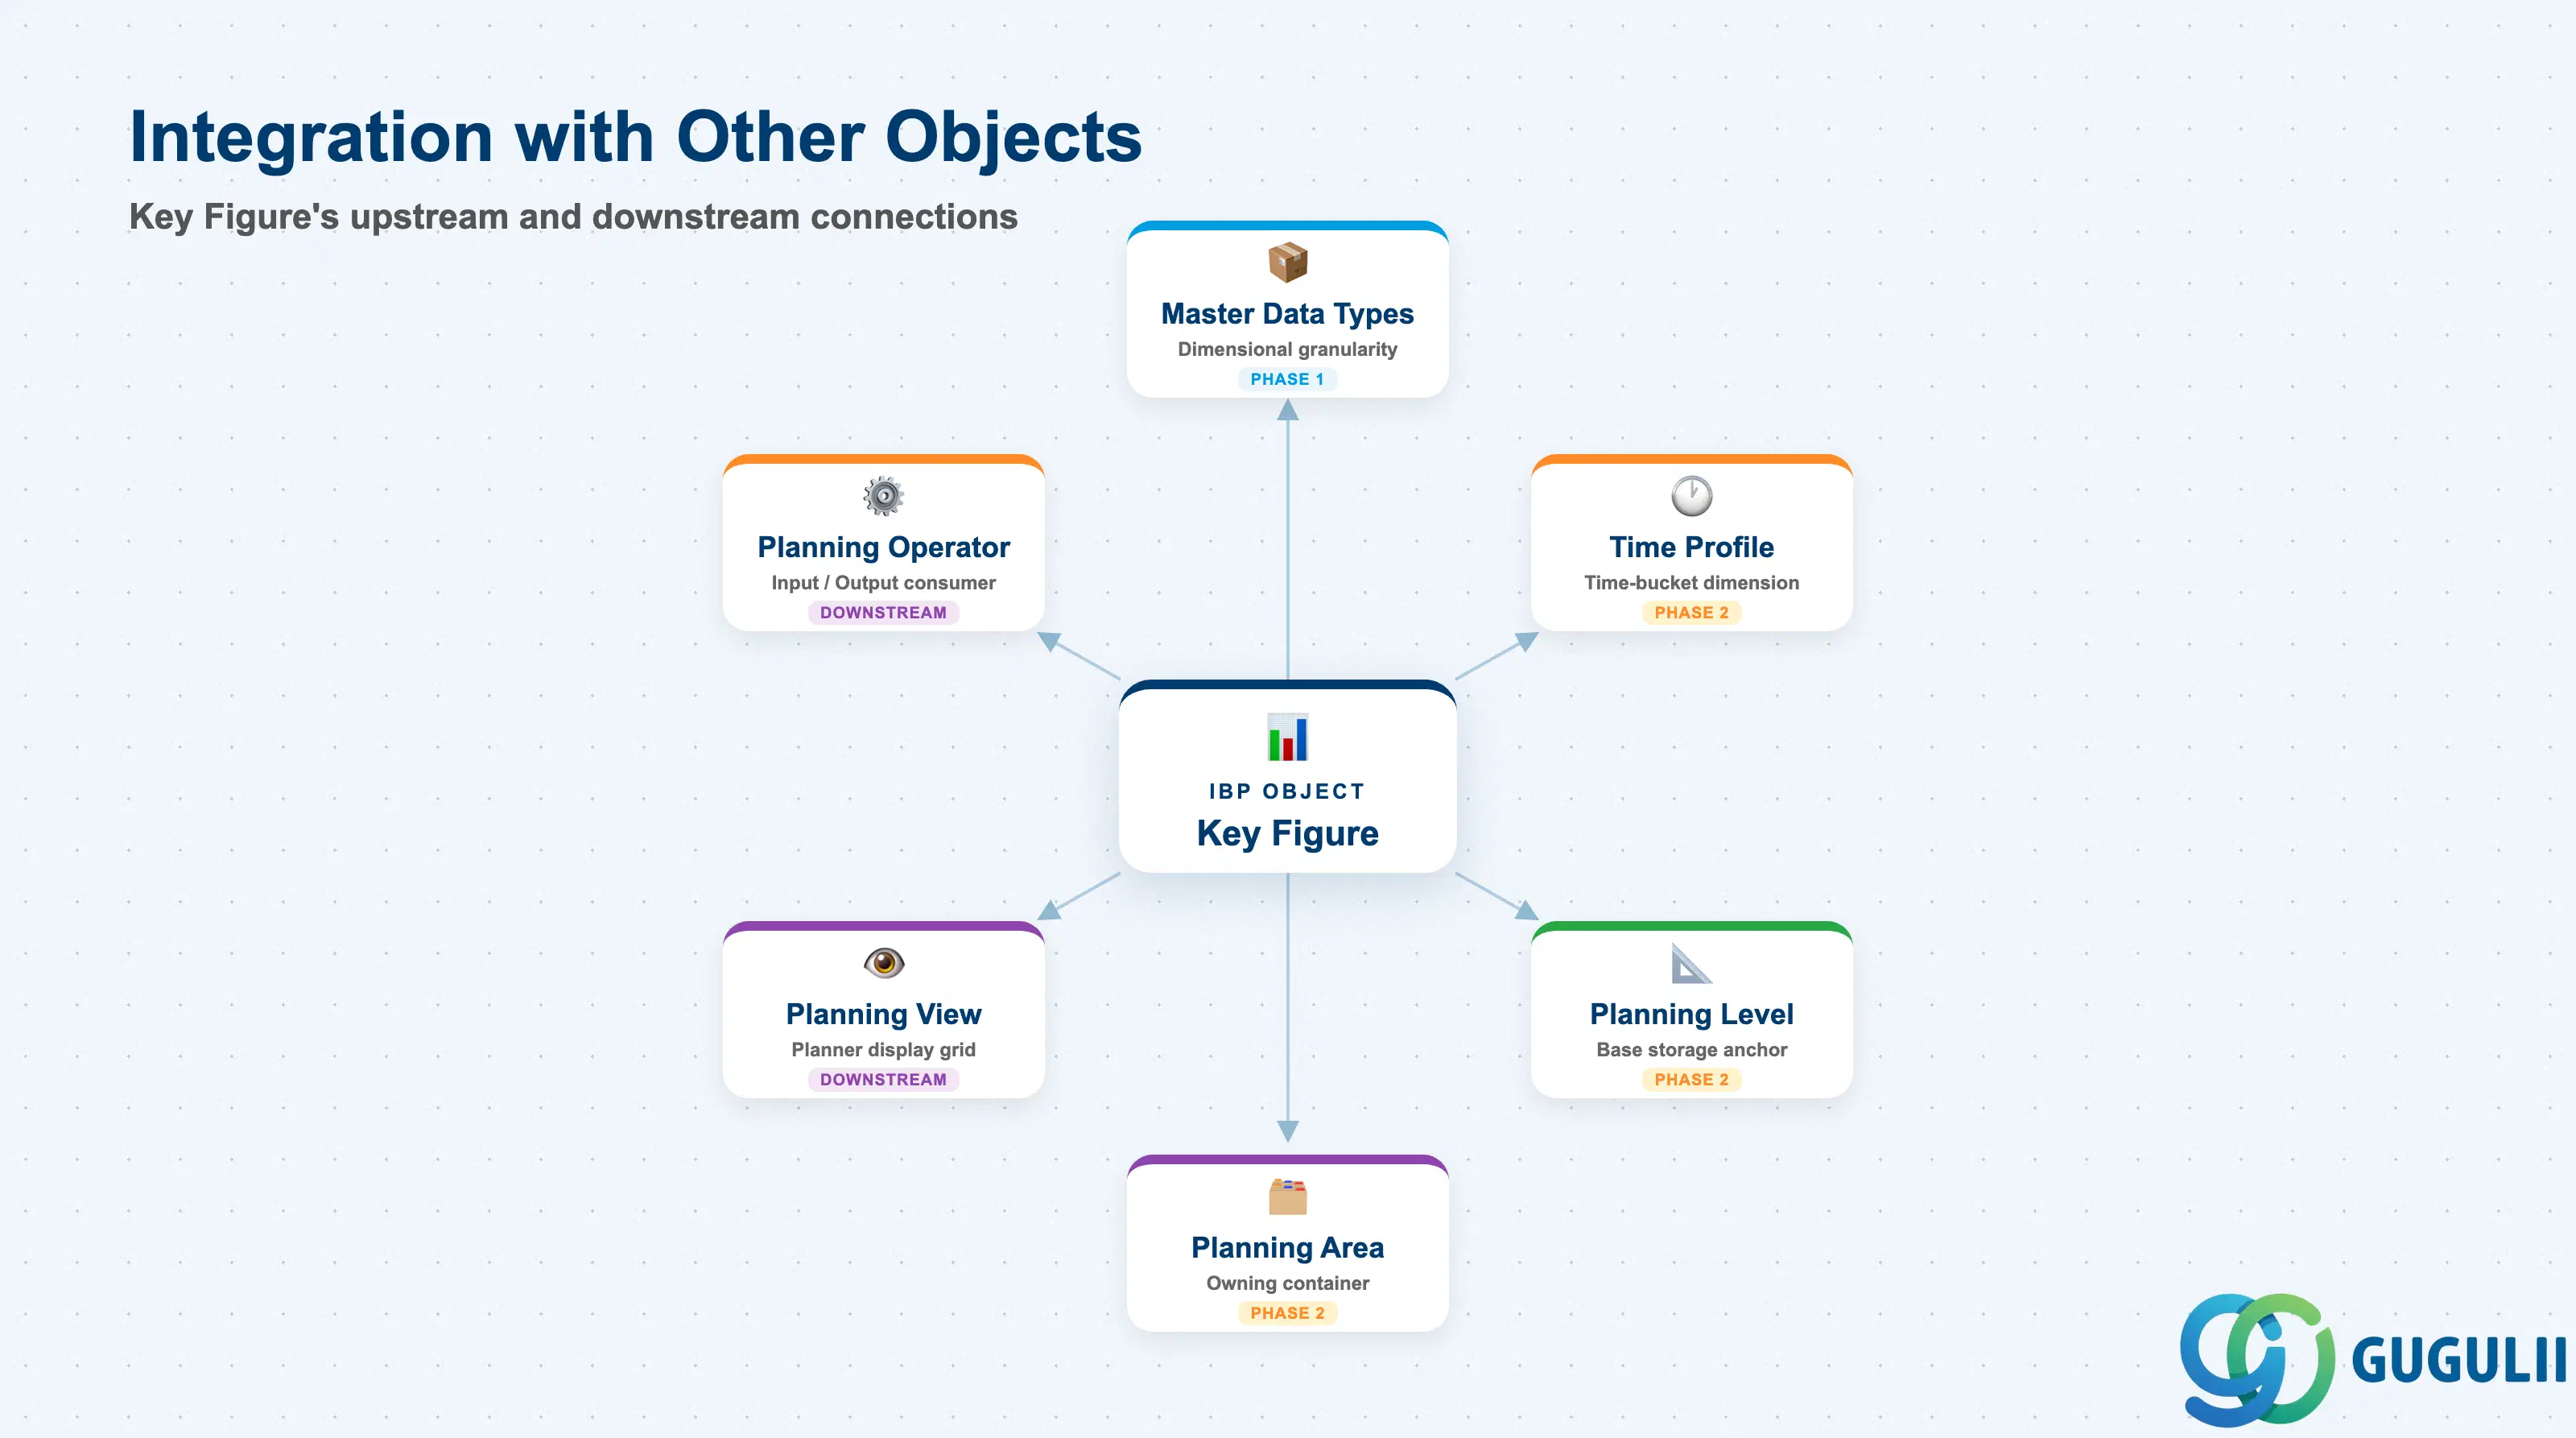
A Key Figure does not stand alone — it exists inside a chain of Phase 2 planning-configuration objects and is consumed further downstream by execution objects.
| Object | Relationship | Practical Notes |
|---|---|---|
| Master Data Types | A Key Figure’s base planning level combines attributes drawn from Master Data Types (Product, Location, Customer, etc.) | Already covered in Phase 1 (IBP-A02-01 through A02-06) — a Key Figure inherits its dimensional granularity from these; it does not define new master data of its own. |
| Time Profile | Supplies the time-bucket dimension (week/month/year) most Aggregation Modes and all Last Period Aggregation logic operate across | Configured once per Planning Area, shared by every Key Figure in that area. |
| Planning Level | Determines the exact dimensional combination a Key Figure can be stored/viewed at; every Key Figure references a base Planning Level | Full mechanics covered in sibling article IBP-A03-02 — this article treats it only as the anchor a Key Figure points to. |
| Planning Area | The container that bundles Time Profile + Planning Level(s) + Key Figure(s) into an activatable planning model | Full mechanics covered in sibling article IBP-A03-03 — a Key Figure cannot exist outside a Planning Area. |
| Planning View | Displays one or more Key Figures to planners in a configurable grid/report | Covered in sibling article IBP-A03-05 — this article’s Key Figures are the data a Planning View renders. |
| Planning Operator | Consumes “Input Key Figures” and writes “Output Key Figures” when it runs (statistical forecast, supply heuristic, inventory optimization, etc.) | Covered in downstream article IBP-A05-01 — this is where the Input/Output usage-role framing from Section 1.2 becomes an explicit configuration setting. |
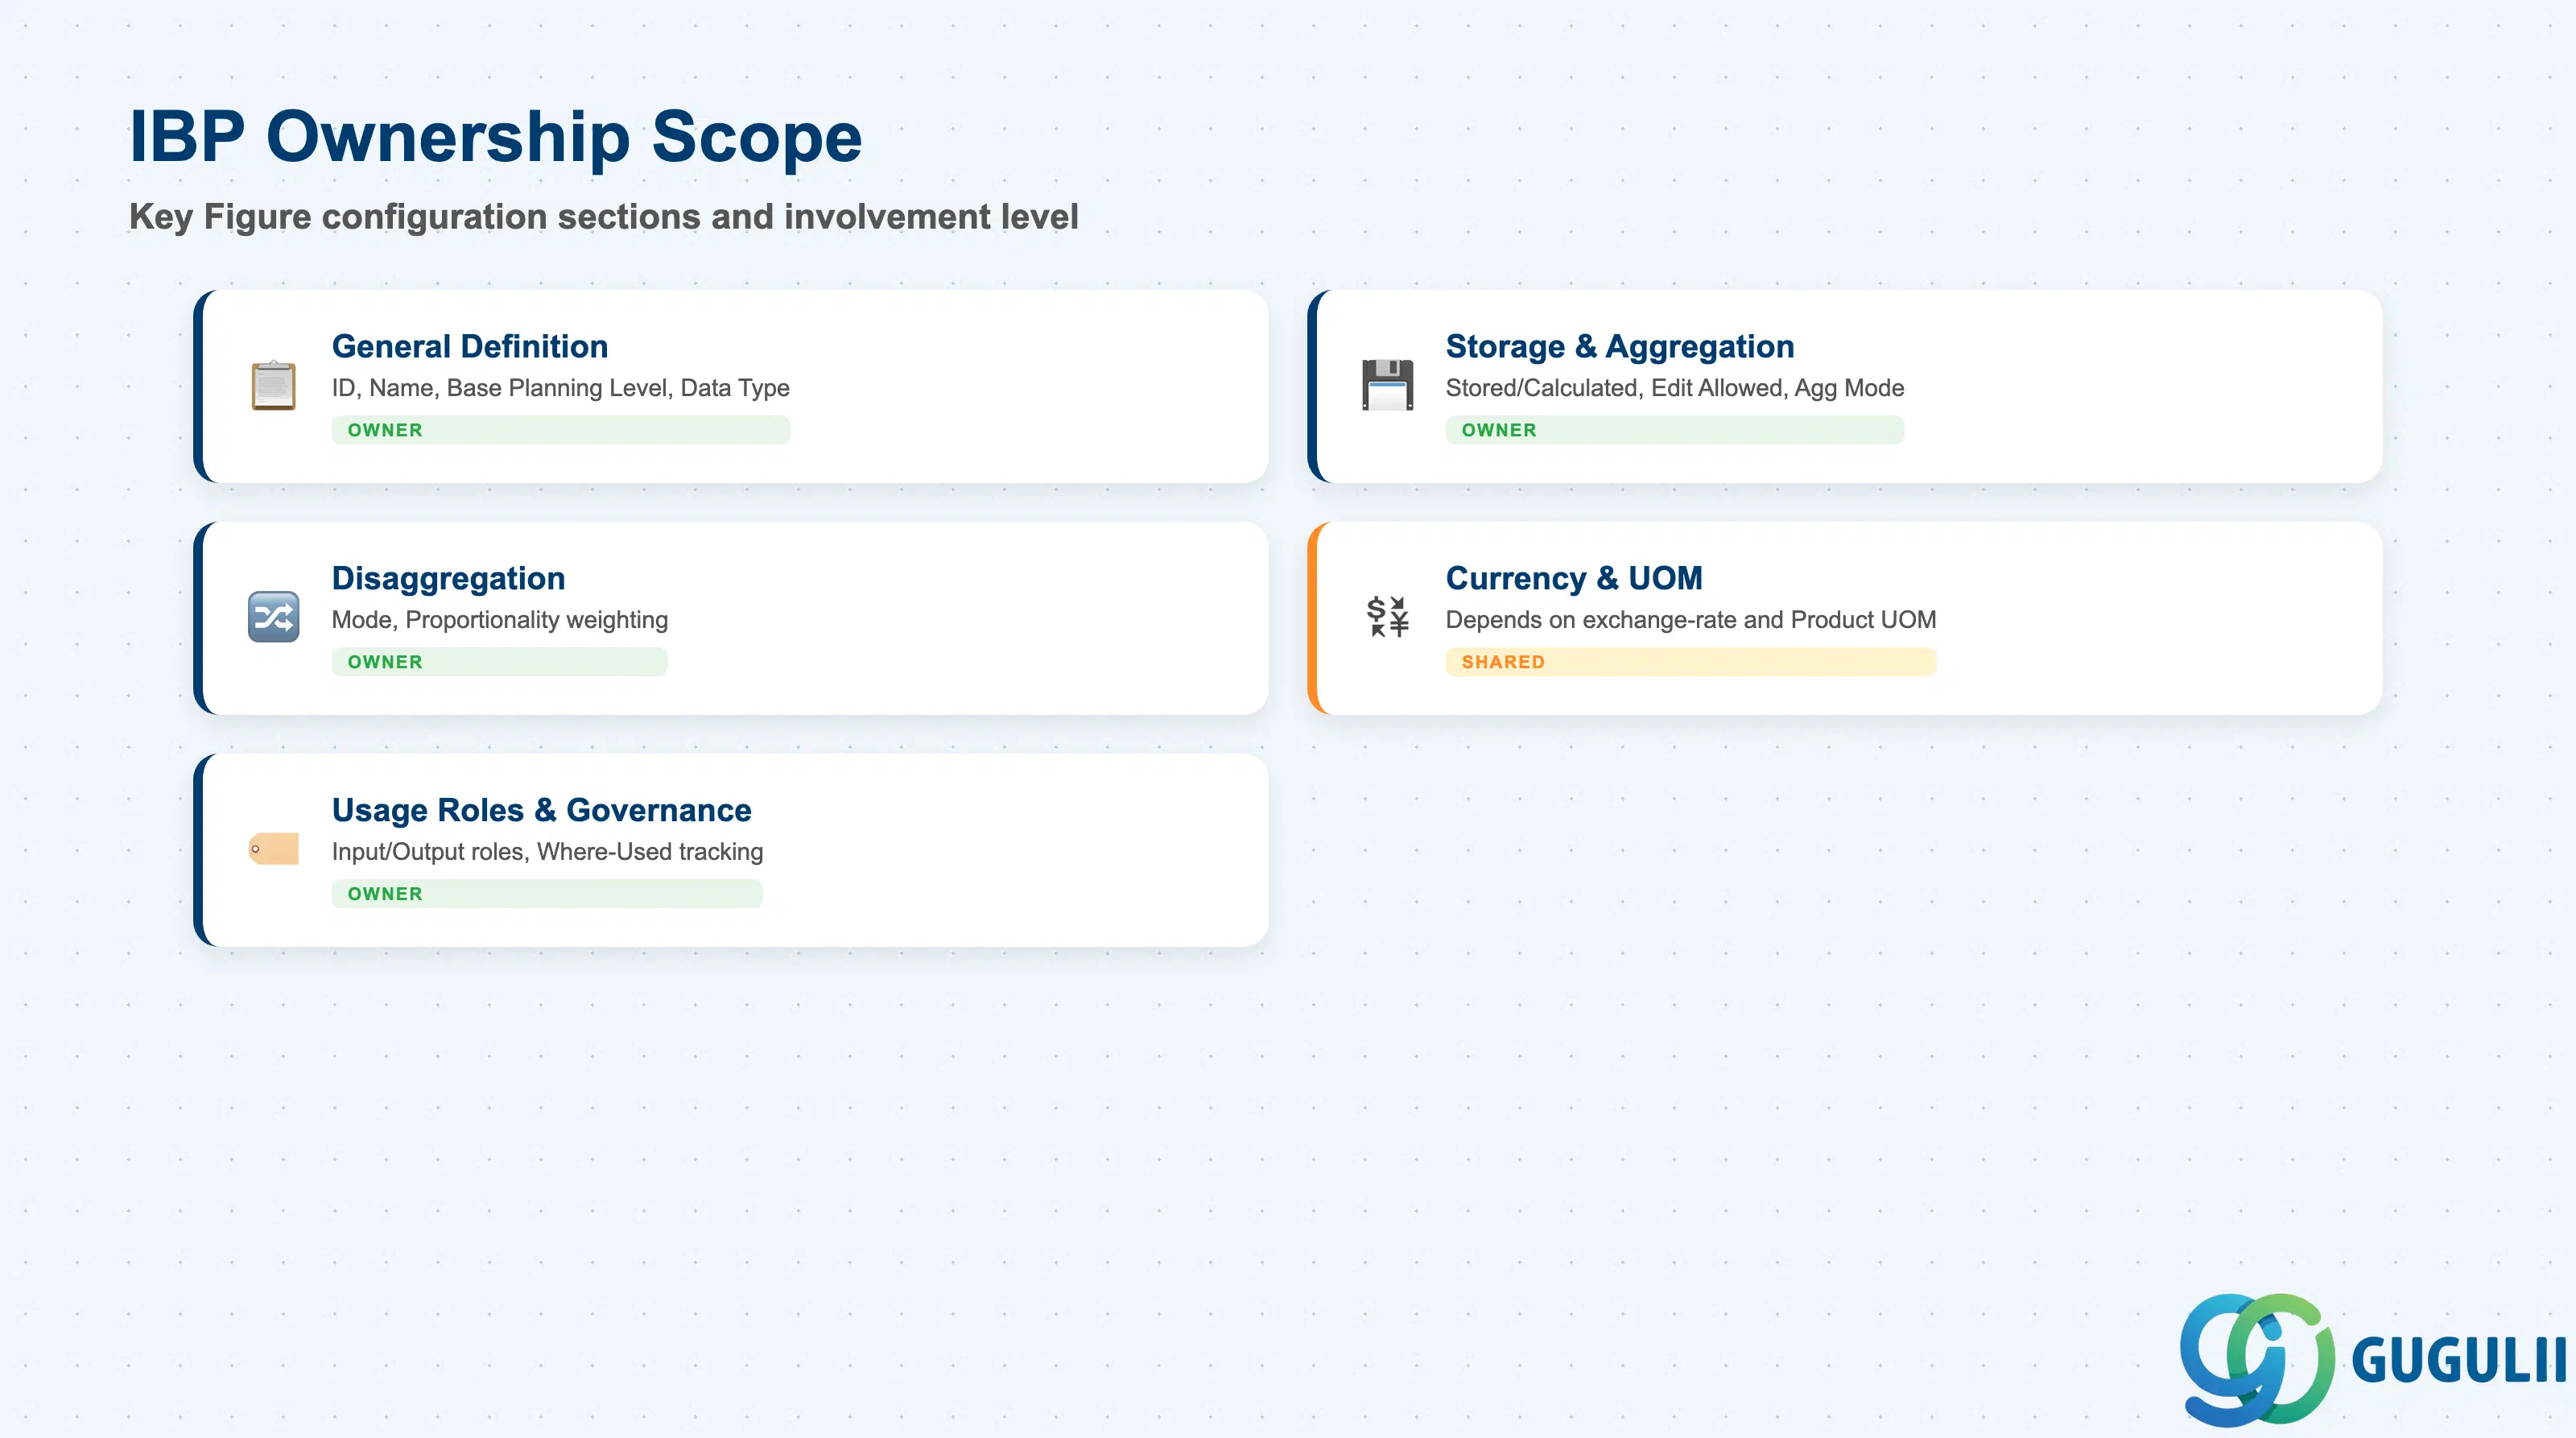
| Data Section | IBP Involvement | Notes |
|---|---|---|
| General Definition | ◎ Owner | Key Figure ID, Name, Description, Base Planning Level, Data Type |
| Storage & Aggregation Configuration | ◎ Owner | Storage Type (Stored/Calculated), Edit Allowed, Aggregation Mode |
| Disaggregation & Proportionality | ◎ Owner | Disaggregation Mode, Proportionality weighting |
| Currency & UOM Conversion | ○ Shared with Master Data governance | Depends on exchange-rate reference data and Product UOM attributes maintained outside the key figure record itself |
| Usage Roles & Governance | ◎ Owner | Input/Output usage-role framing, Where-Used Information app, advanced patterns |
Legend: ◎ = Owner / Critical, ○ = Direct involvement
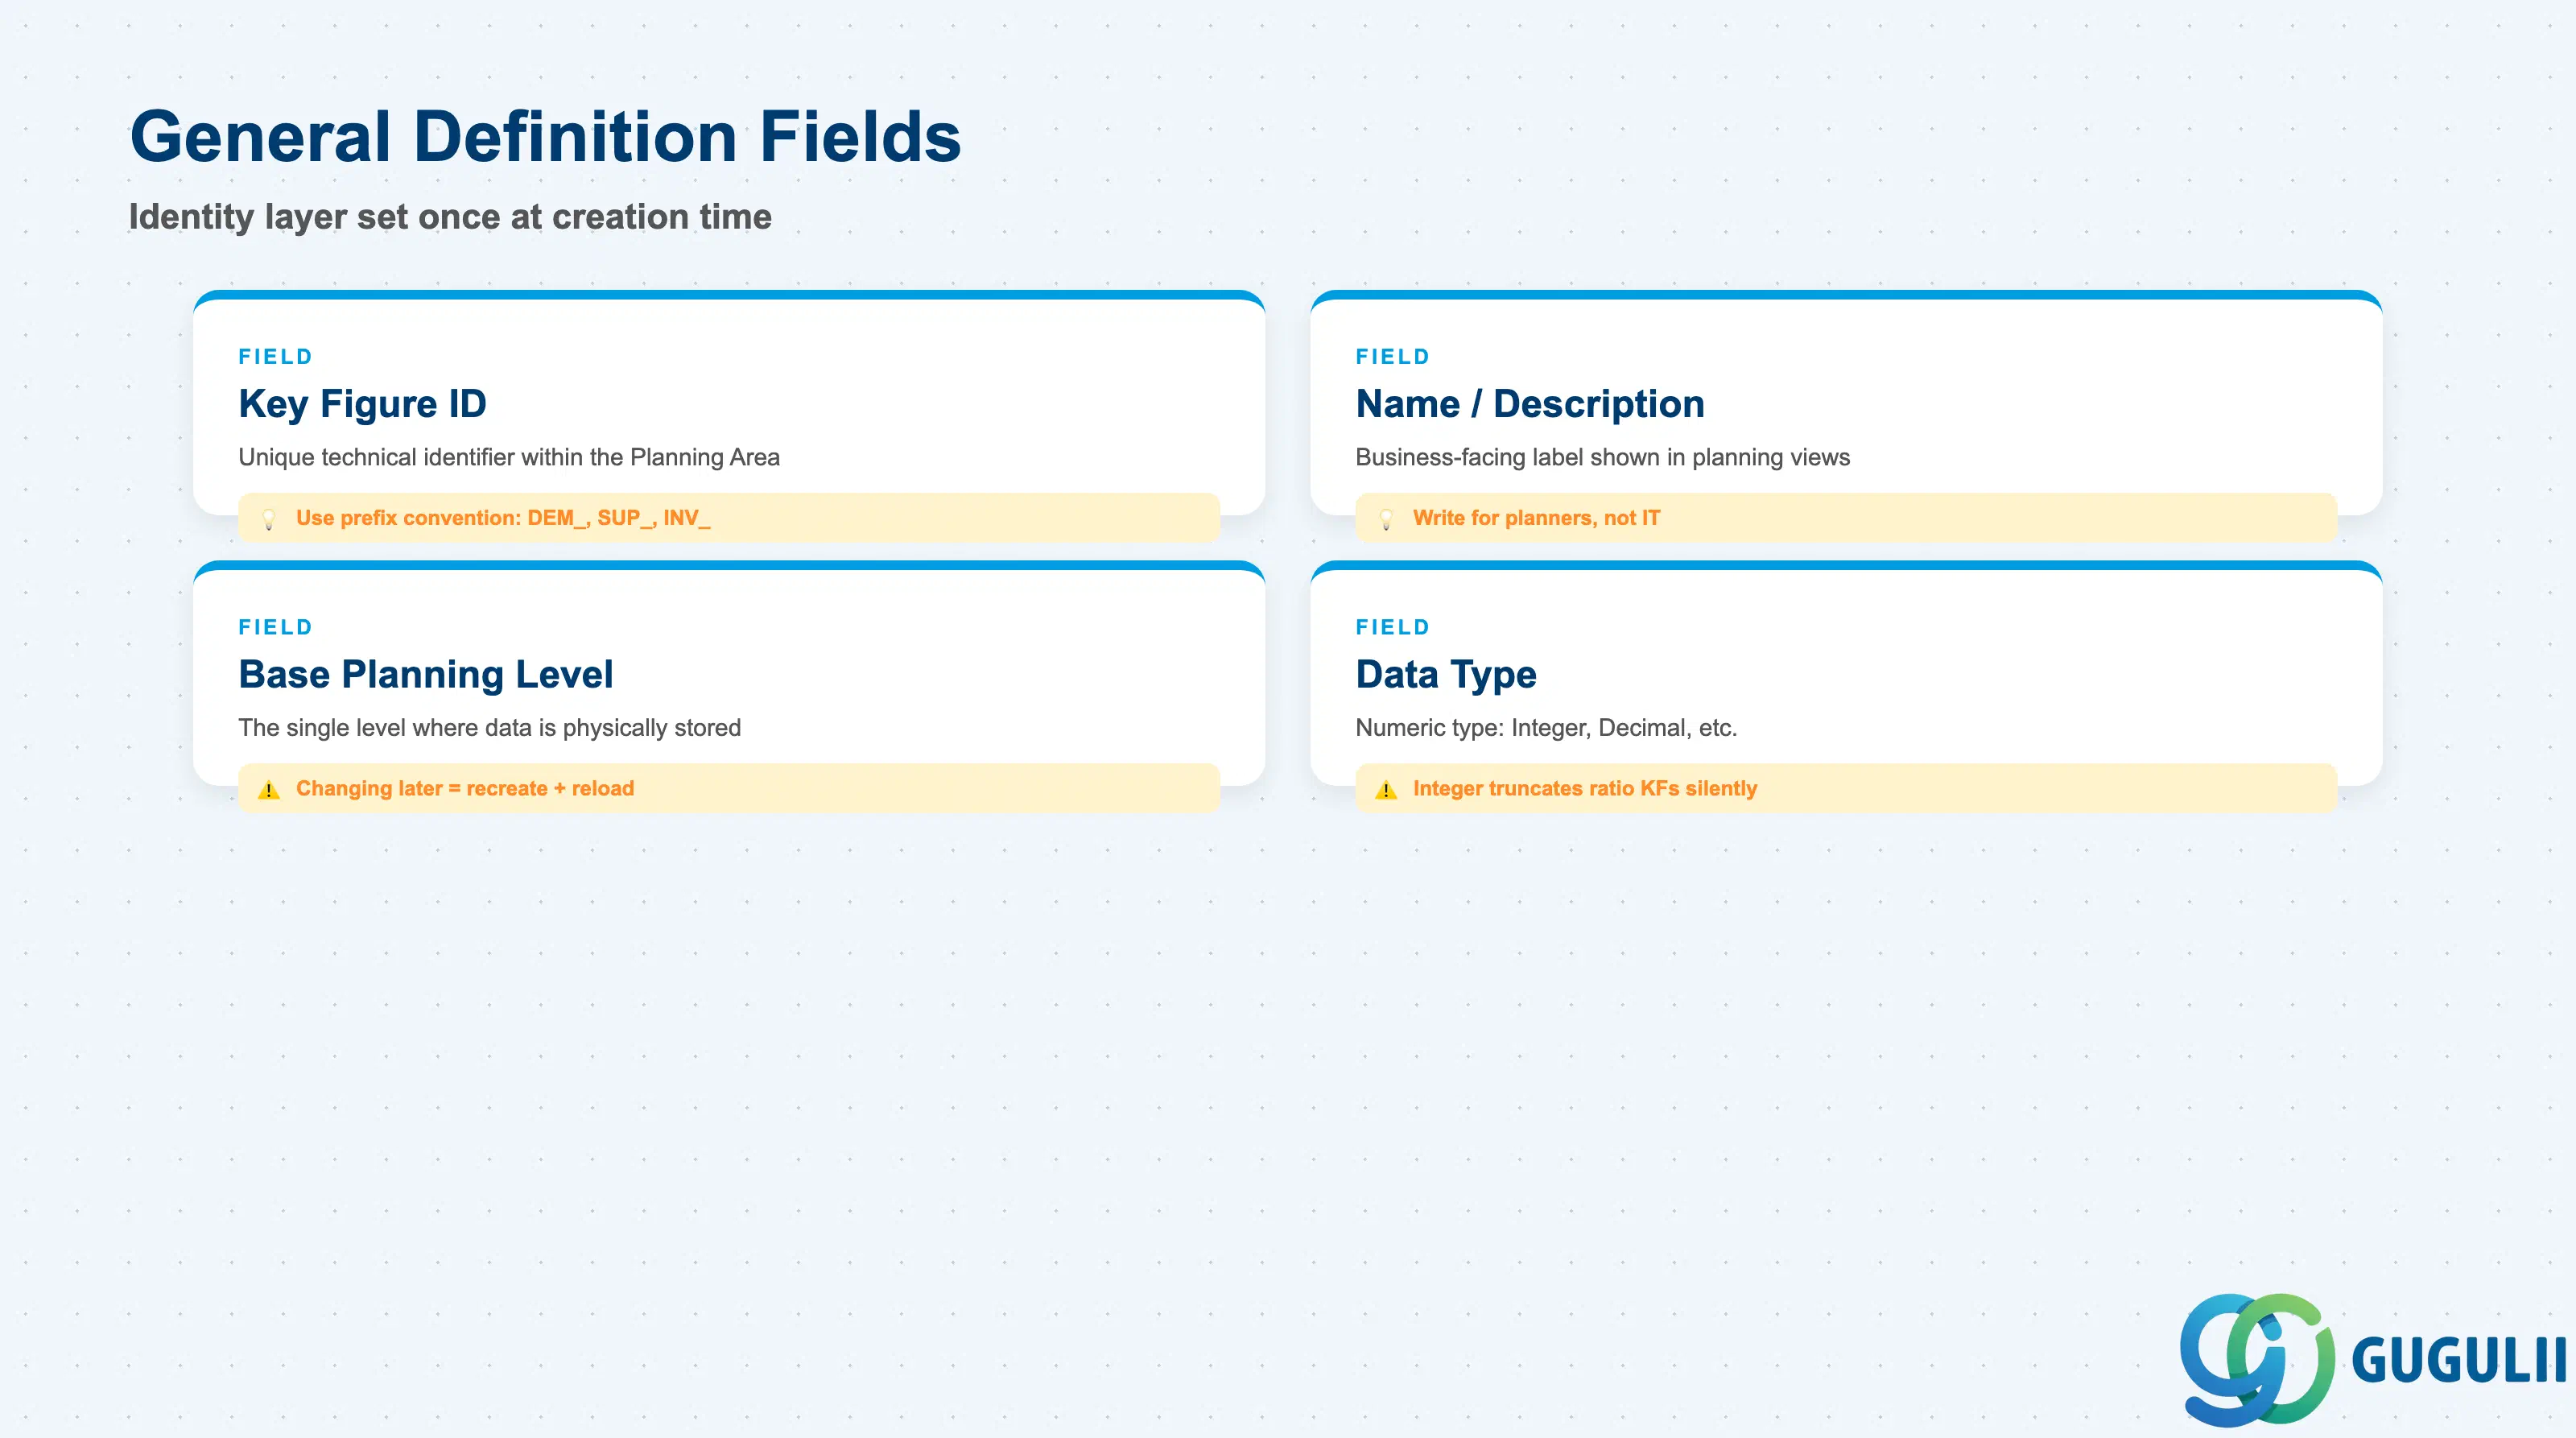
General Definition is the identity layer of the Key Figure — set once when the key figure is created, on the Planning Area’s Configuration tab.
| Field | Description | Practical Usage |
|---|---|---|
| Key Figure ID | Unique technical identifier for the key figure within the Planning Area | Adopt a naming convention early (e.g. prefix by process: DEM_, SUP_, INV_) — key figures accumulate quickly once formulas and Planning Operators start referencing each other, and an inconsistent scheme becomes a real maintenance drag within a few sprints. |
| Name / Description | Business-facing label and longer description shown in planning views and the Excel Add-in | This is what planners see, not the technical ID — write it the way a demand planner or supply planner would recognize it, not the way IT would name it internally. |
| Base Planning Level | The single planning level at which this key figure’s data is physically stored | Fix this at design time. Changing a live key figure’s base planning level later typically means recreating it and reloading history, since it changes where and how granularly the values are stored. |
| Data Type | Numeric type — Integer, Decimal, etc. | Decimal precision matters for ratio/percentage key figures (fill rate, forecast accuracy) — an Integer-typed ratio silently truncates and produces misleading 0% / 100% readings in dashboards. |
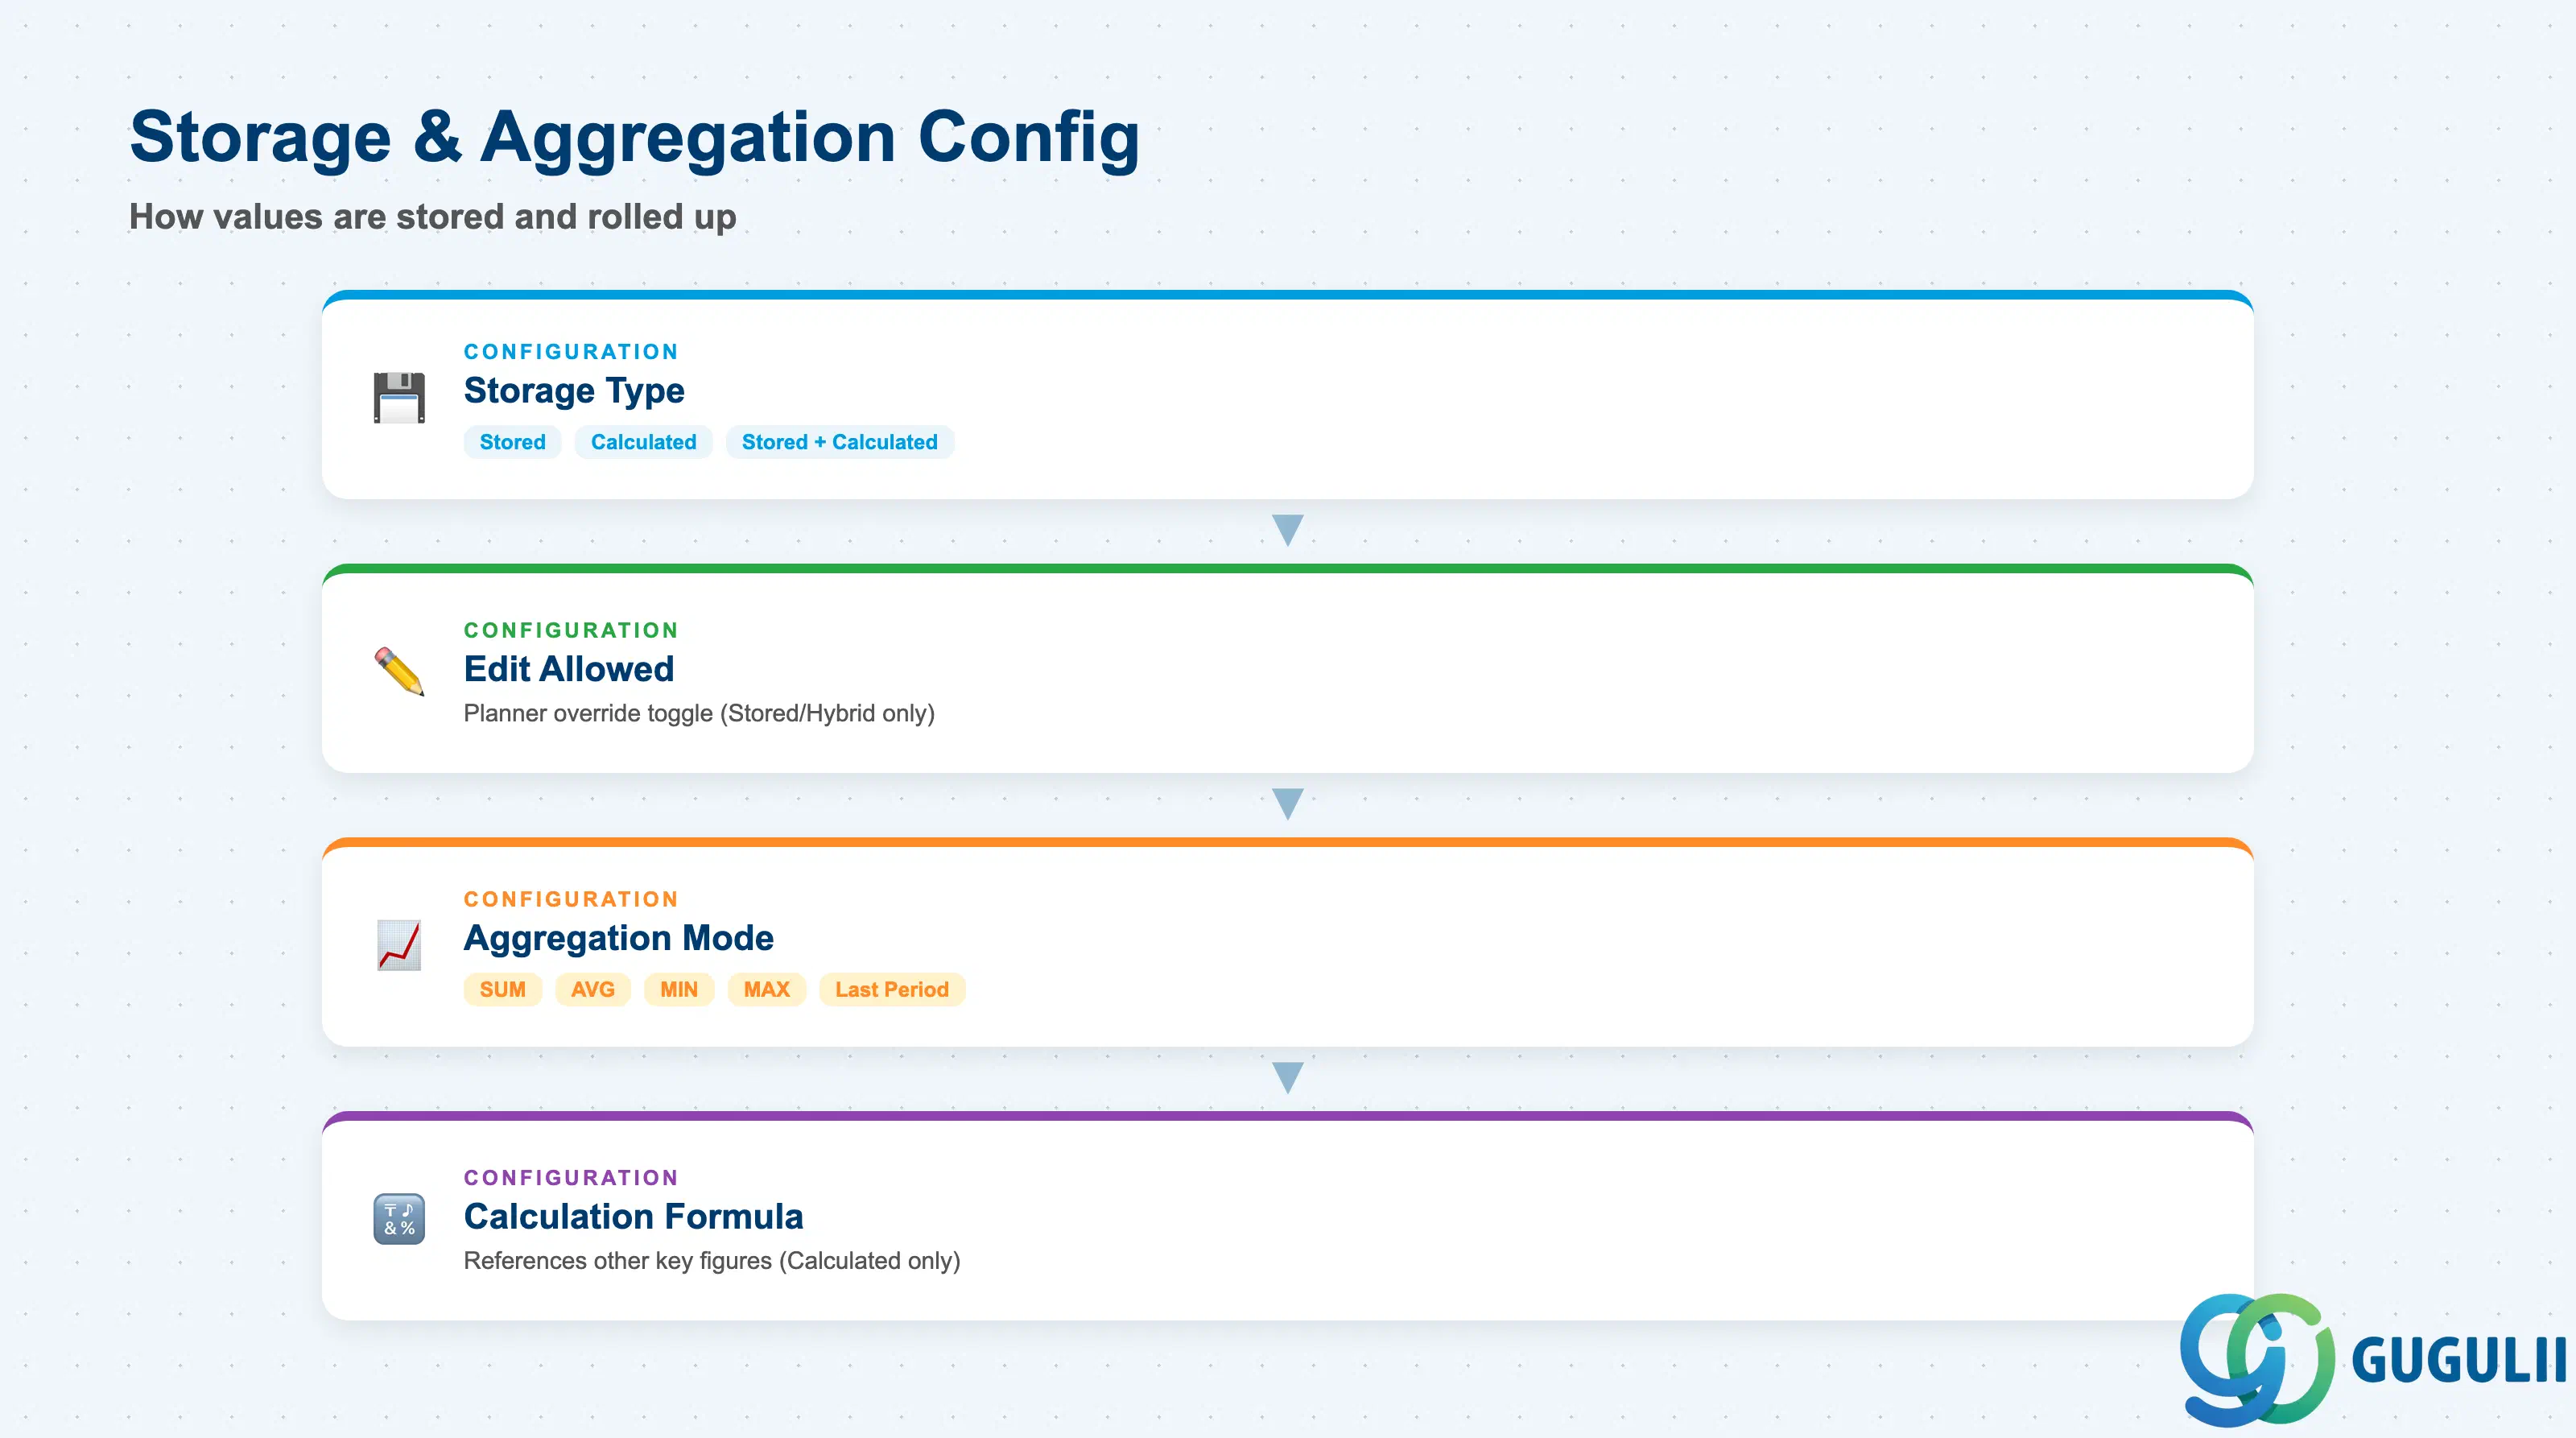
This is where the Stored-vs-Calculated axis from Section 1.2 becomes concrete configuration, along with how values roll up from the base planning level to higher levels.
| Field | Description | Practical Usage |
|---|---|---|
| Storage Type | Stored / Calculated / Stored+Calculated hybrid | Get this right before building downstream calculations — a Calculated key figure referenced heavily by other formulas is recalculated on every read, and cannot receive a manual planner override unless also flagged Stored. |
| Edit Allowed | Whether a planner can manually enter/overwrite a value for this key figure in a planning view | Only available for Stored (or hybrid Stored+Calculated) key figures — enabling it on a purely Calculated key figure has nothing to write to and is not a valid configuration. |
| Aggregation Mode | SUM, AVG, MIN, MAX, COUNT, STDDEV, or Last Period Aggregation | SUM is the default for flow quantities (demand, supply). For stock/inventory-type key figures, a common nuance: SUM across product/location, but AVG across time — inventory doesn’t “add up” meaningfully across months. Use Last Period Aggregation for point-in-time balances (e.g. end-of-month stock) where summing across the period would double-count. |
| Calculation Formula | The formula referencing other key figures / master data attributes (Calculated key figures only) | Formulas can combine inputs stored at different base planning levels — IBP aggregates or disaggregates each input to a common calculation level internally before evaluating. Document the formula’s business logic outside the system too; the formula field alone doesn’t explain why a ratio is built the way it is. |
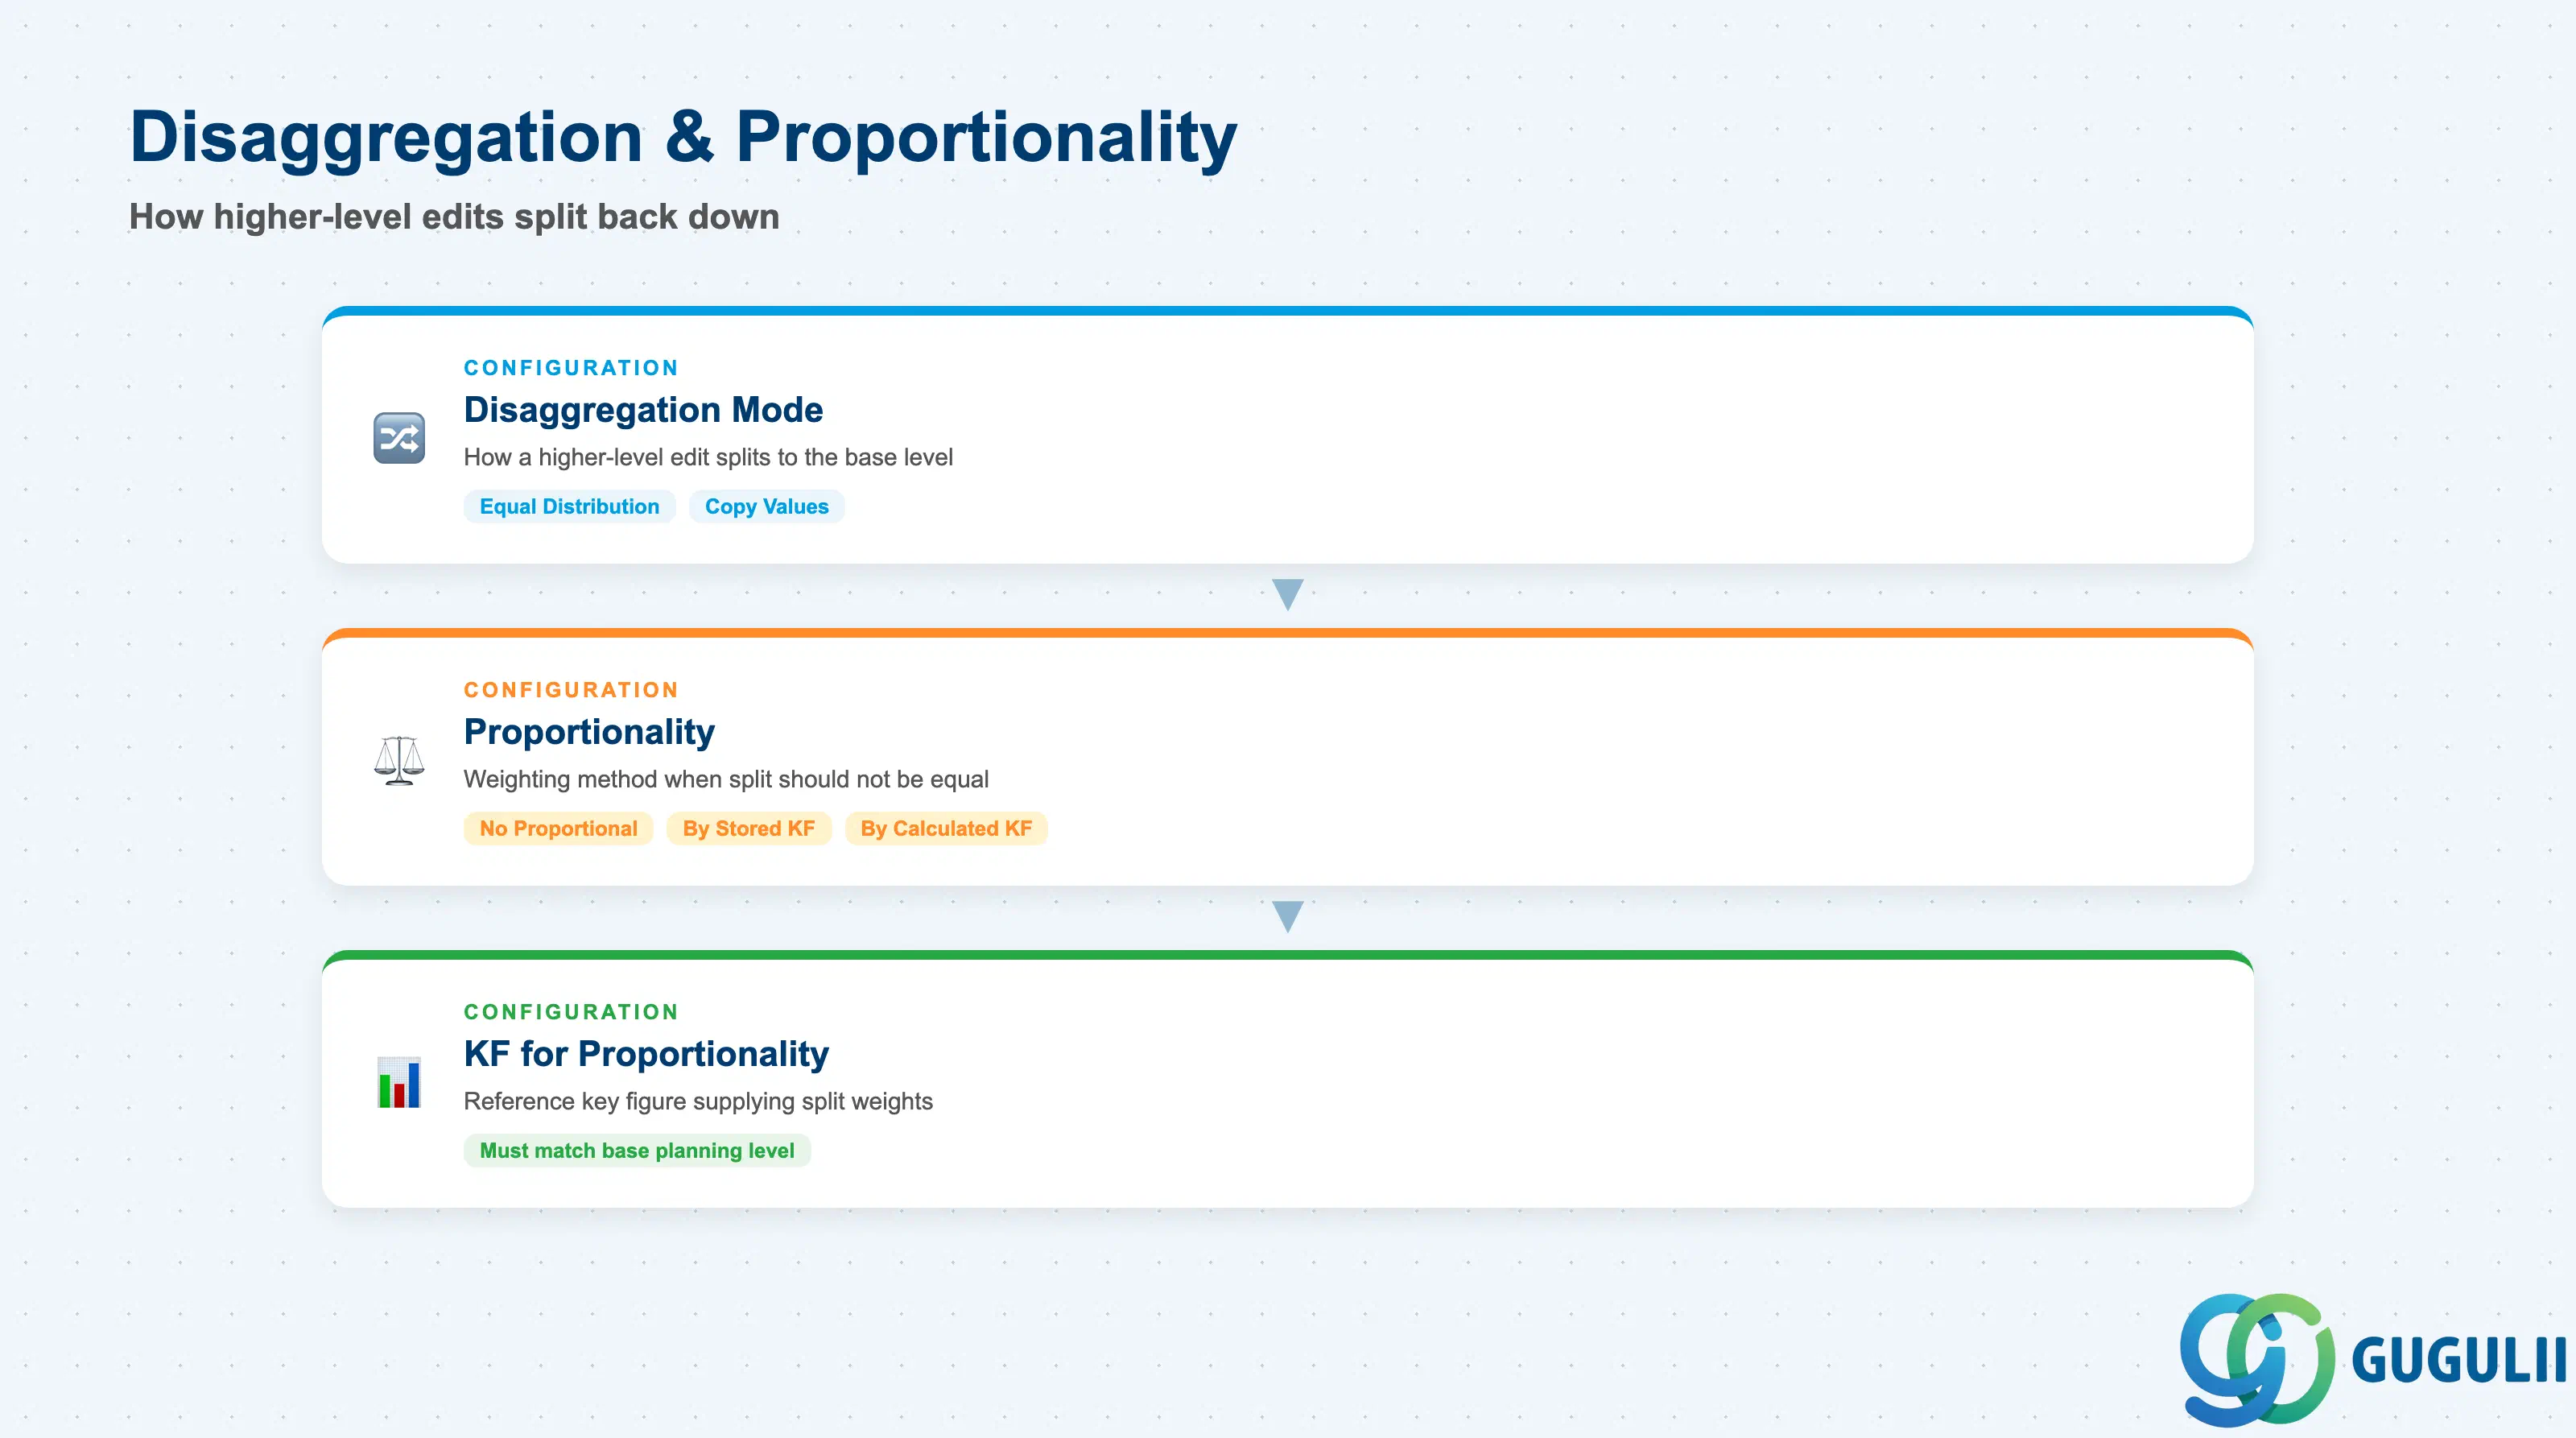
Disaggregation is the flip side of aggregation: when a planner edits a value at a higher level, the system automatically splits it back down to the base planning level.
| Field | Description | Practical Usage |
|---|---|---|
| Disaggregation Mode | How an edit made at a higher level is split down to the base planning level | Two base modes: Equal Distribution (splits the value evenly across the lower-level members) and Copy Values (writes the same value into every target bucket rather than splitting it). Only Stored key figures can be disaggregation targets — a purely Calculated key figure has no storage row to write the split into. |
| Proportionality | The weighting method used when the split should not be equal | Options include “No Proportional Disaggregation” (falls back to Equal Distribution), weighting by another key figure’s stored values, and — since IBP release 2208 — weighting by another key figure’s calculated values (e.g. splitting a regional demand number down to products in proportion to each product’s historical sales share). |
| Key Figure for Proportionality | The reference key figure supplying the split weights | Must itself be populated at (or derivable to) the same base planning level as the key figure being disaggregated — a mismatch here is a common cause of an unexpectedly even split when a proportional one was intended. |
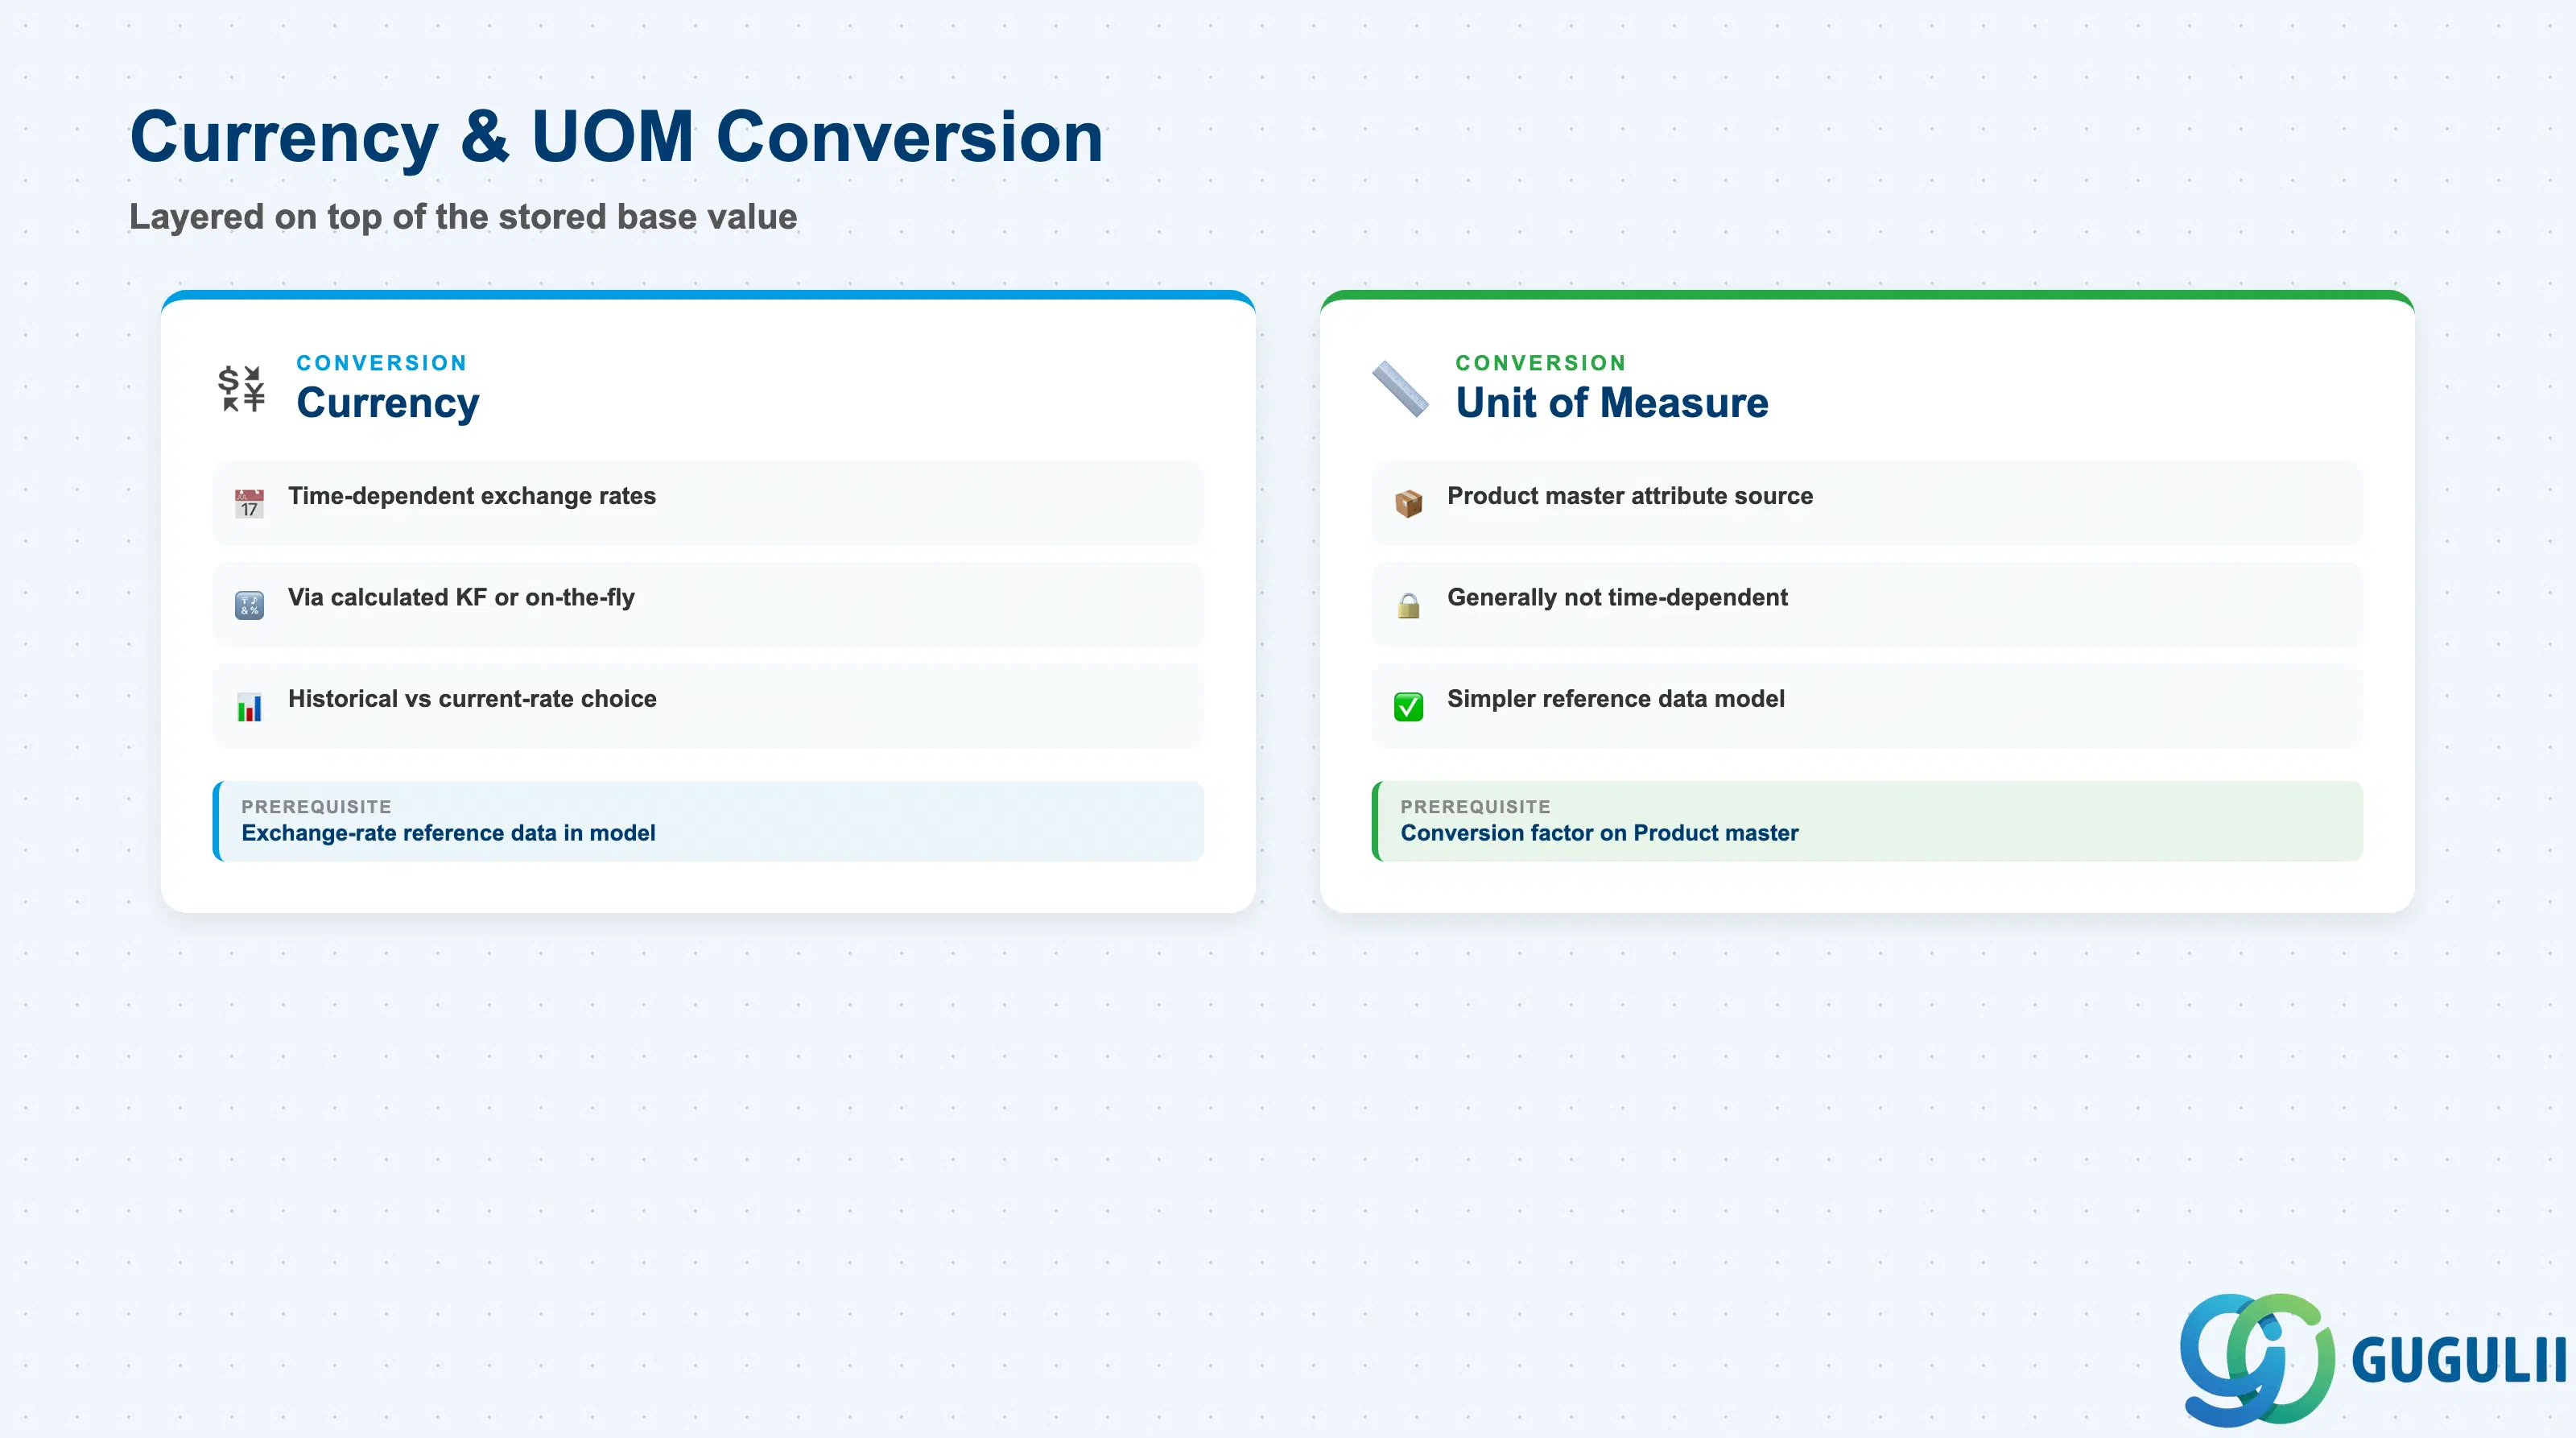
Currency and UOM handling are layered on top of a Key Figure’s stored base value — neither is a fixed property of the key figure record itself.
| Field | Description | Practical Usage |
|---|---|---|
| Currency Conversion | Converts a key figure’s stored base-currency amount to a target currency, either via a dedicated calculated key figure multiplying against exchange-rate reference data, or on-the-fly at query time in the Excel Add-in / Analytics | Exchange-rate reference data is typically time-dependent — confirm during blueprint whether the project needs point-in-time historical rates (audit/variance reporting) or current-rate-only conversion; retrofitting time-dependency later is rework. |
| Unit of Measure Conversion | Converts a key figure’s stored base UOM to a target UOM using a conversion factor sourced from a Product master attribute | Unlike currency, UOM factors are generally not time-dependent (a case-to-each ratio rarely changes week to week), which simplifies the reference data model relative to currency conversion. |
| Target selection | Whether the target currency/UOM is fixed by a calculated key figure, or selectable at runtime by the planner | On-the-fly runtime selection (Excel Add-in / Analytics) avoids building a separate calculated key figure per target currency/UOM — prefer it unless the business specifically needs a persisted, reportable converted value. |
Prerequisite: Currency conversion requires exchange-rate reference data to already exist in the model (typically a compound master data type pairing “Currency From” / “Currency To” with a rate value); UOM conversion requires the conversion factor to be maintained as a Product master attribute. Neither works out of the box without this reference data in place.
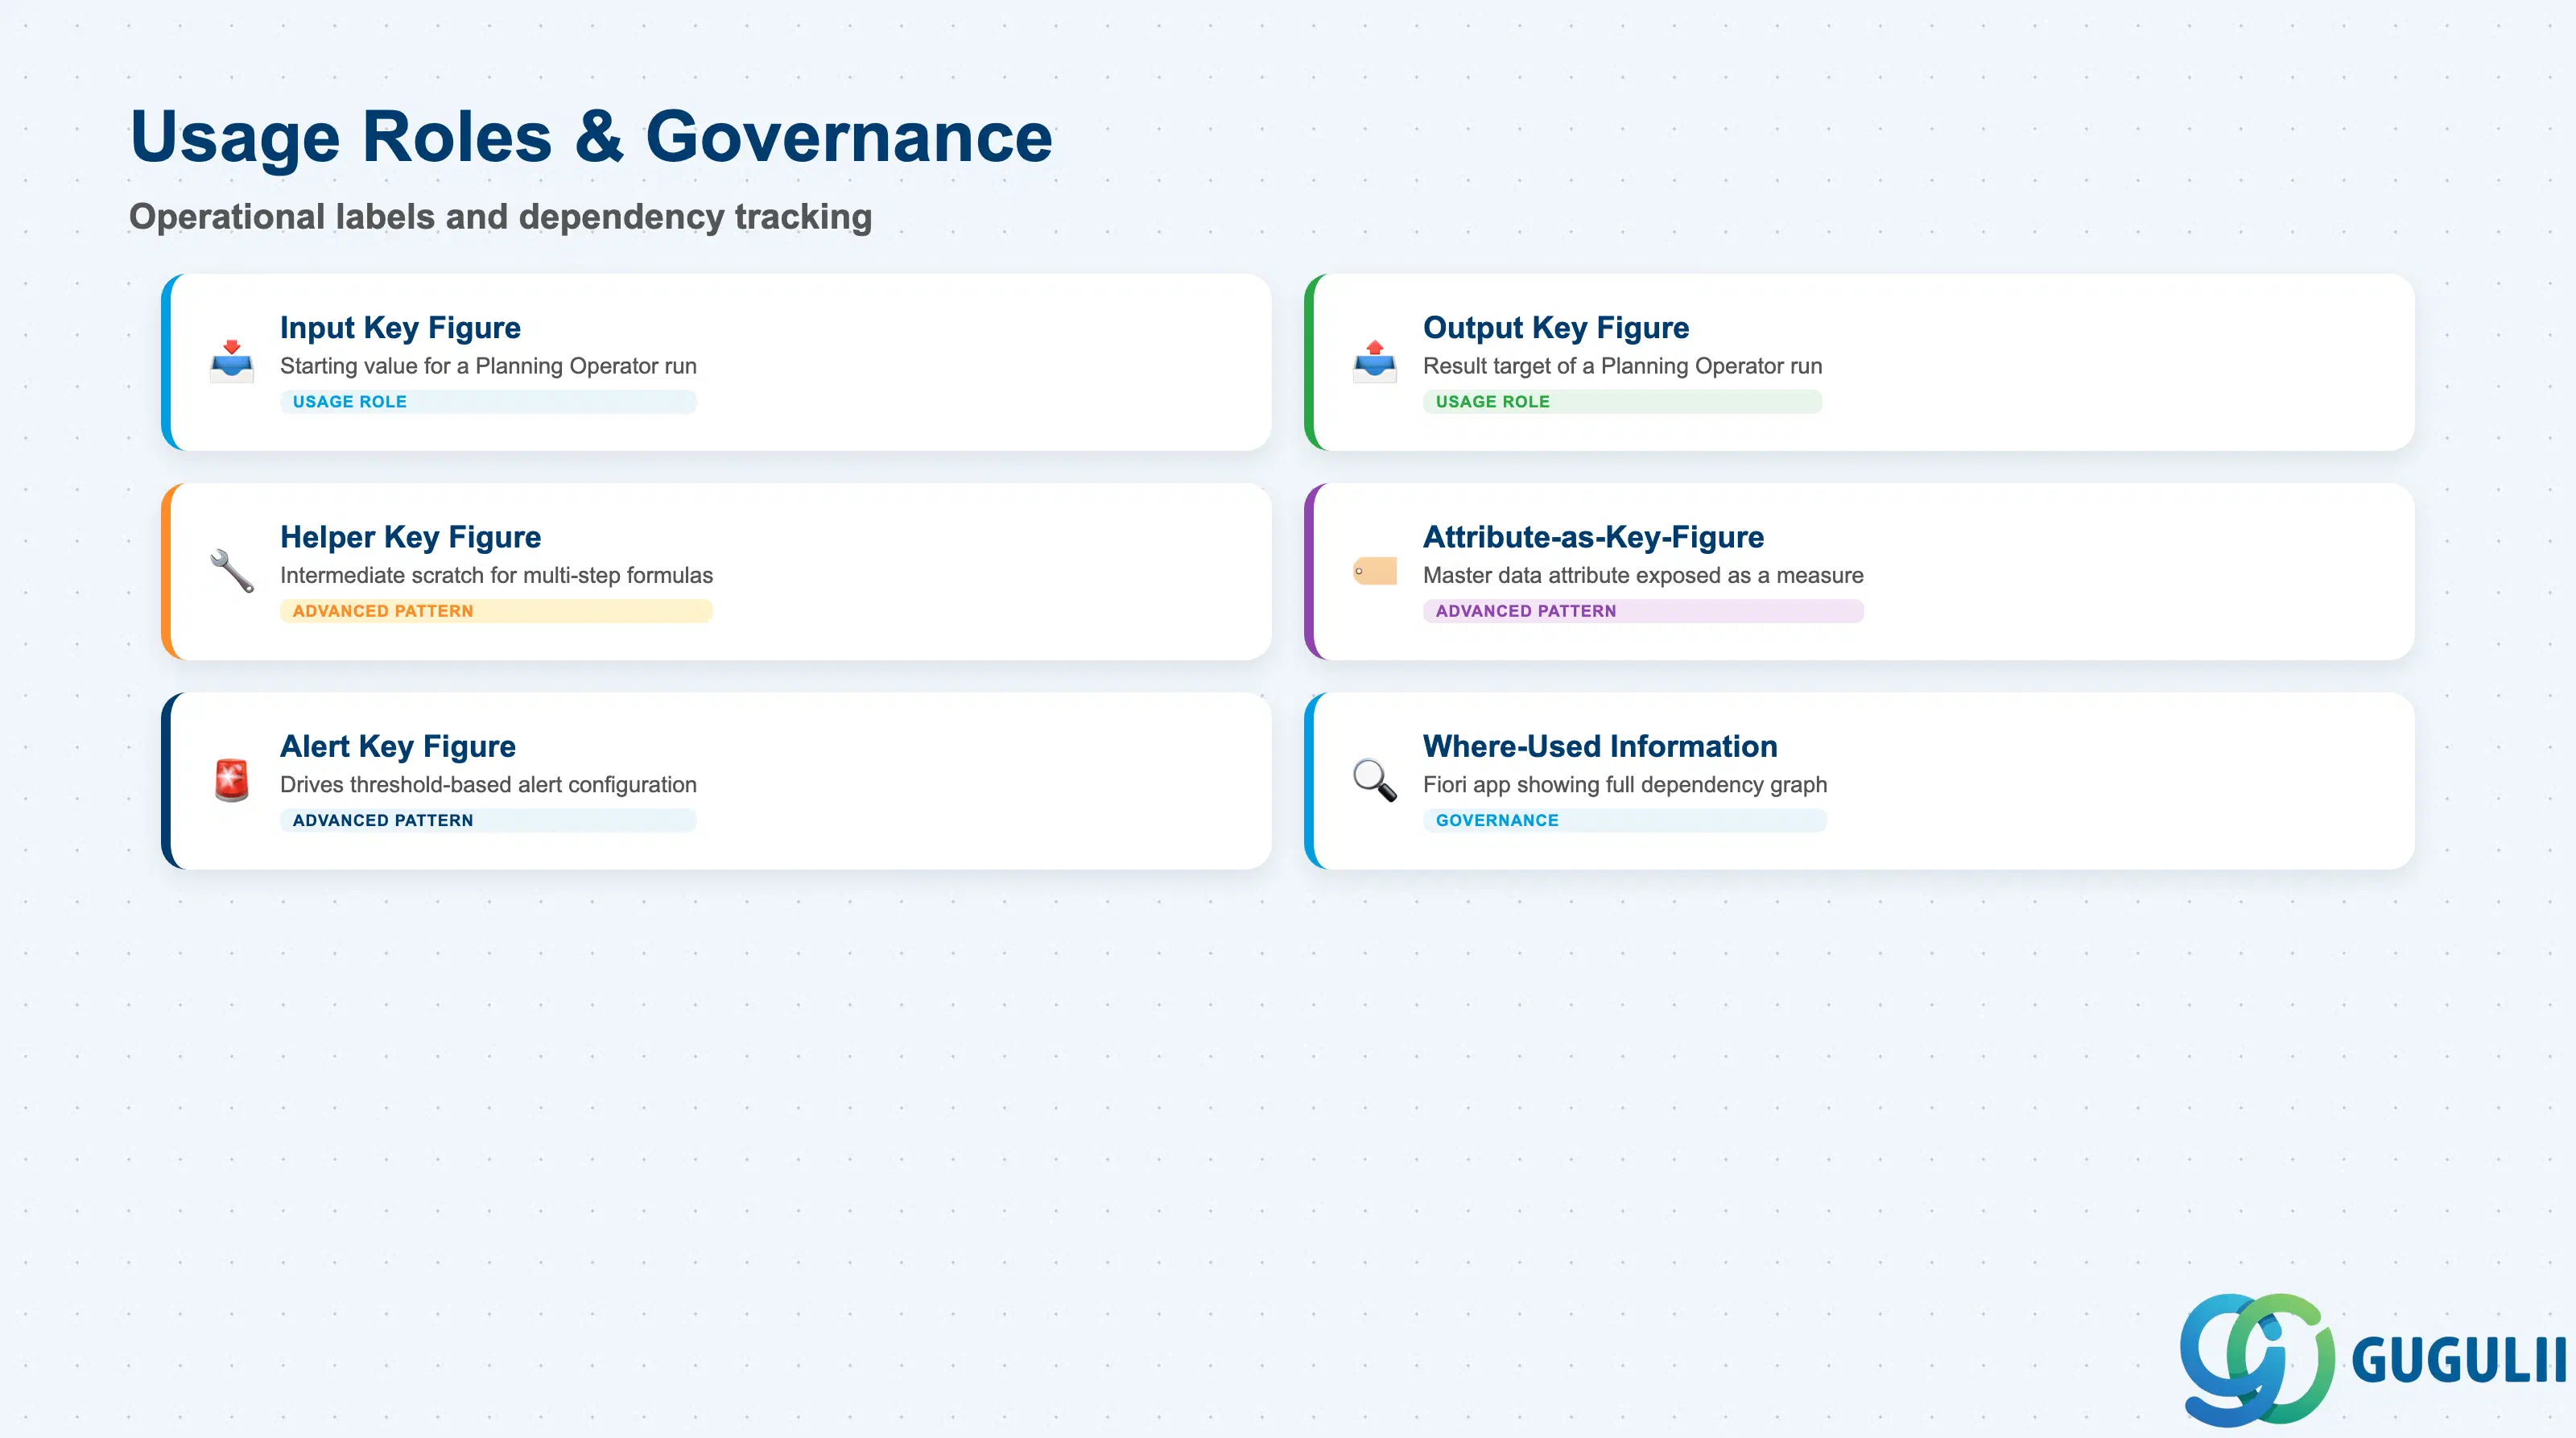
This section returns to the Input/Output usage-role framing introduced in Section 1.2, now shown as it appears operationally, alongside a few advanced key figure patterns and the governance app consultants should know before changing or deleting a live key figure.
| Field / Concept | Description | Practical Usage |
|---|---|---|
| Input Key Figure (usage role) | A key figure a Planning Operator reads as a starting value for a run | Configured explicitly on the Planning Operator (e.g. a statistical forecast operator’s “Input Key Figures” setting) — it is a role assignment, not a separate storage type; see Section 1.2. |
| Output Key Figure (usage role) | A key figure — Stored or Calculated — that a Planning Operator writes its result into | Same caveat as Input: the storage mechanics were already decided by Storage Type in Section 2.2. “Output” only describes that this run’s result lands here. |
| Helper Key Figure | An intermediate/scratch key figure used only to simplify a multi-step calculation | Not meant for direct end-user display — a useful pattern for breaking a complex formula into readable, testable pieces. Keep the naming convention distinct (e.g. an _HLP suffix) so planners don’t accidentally add helper figures to a planning view. |
| Attribute-as-Key-Figure | A technique for exposing a master-data attribute value through the key-figure mechanism | Lets an attribute (e.g. a Product’s standard cost) appear alongside true key figures in planning views and calculations — useful, but don’t confuse it with a genuine transactional measure when reviewing a data model. |
| Alert Key Figure | A key figure used specifically to drive threshold-based alerts | Typically a Calculated key figure comparing an actual/planned value against a threshold (e.g. flagging capacity overloads or stock-outs) — the alert logic itself lives in Alert configuration, not in the key figure record. |
| Where-Used Information for Key Figures | Fiori app listing every calculation, Copy Operator, and Excel Planning Template that references a selected key figure | Run this before changing or deleting a key figure with a wide dependency graph — especially one feeding Planning Operators — to see the full blast radius first. Access to this governance capability is gated by a dedicated business catalog. |
| ID | Category | Title |
|---|---|---|
| ibp-001 | Overview | What is SAP IBP? |
| ID | Category | Title |
|---|---|---|
| ibp-a01 | Overview | SAP IBP Master Data: Overview, Hierarchy & Relationships |
| ibp-a02-01 | Master Data | SAP IBP Master Data Types |
| ibp-a02-02 | Master Data | SAP IBP Attribute |
| ibp-a02-03 | Master Data | SAP IBP Time Profile |
| ibp-a02-05 | Master Data | SAP IBP Location Master |
| ibp-a03-01 | Master Data | SAP IBP Key Figure 📍 |
| ibp-a03-02 | Master Data | SAP IBP Planning Level |
| ibp-a03-03 | Master Data | SAP IBP Planning Area |
| ibp-a03-04 | Master Data | SAP IBP Planning Version |
| ibp-a03-05 | Master Data | SAP IBP Planning View |
| ibp-a04-01 | Master Data | SAP IBP Integration Model |
| ibp-a05-01 | Master Data | SAP IBP Planning Operator |
| ID | Category | Title |
|---|---|---|
| ibp-b01 | Overview | SAP IBP Transactions: Process Flow, Hierarchy & Relationships |