Title here
Summary here

A Planning View is the SAP IBP object that defines a specific, reusable screen layout — a row/column/filter arrangement of Key Figures — through which a planner actually views, enters, and edits planning data. It is the final object in this five-article Phase 2 group, and structurally the widest-fan-in object alongside Planning Area itself: a single Planning View is built directly against an activated Planning Area, scoped to one Version, and populated with a chosen set of Key Figures. Where the prior four articles (Key Figure, Planning Level, Planning Area, Version) covered the modeling layer a planner rarely touches directly, this article covers the consumption layer sitting on top of all of them — what the planner actually sees, and the two channels (Excel Add-in and Planner Workspace) that render the same configured view.
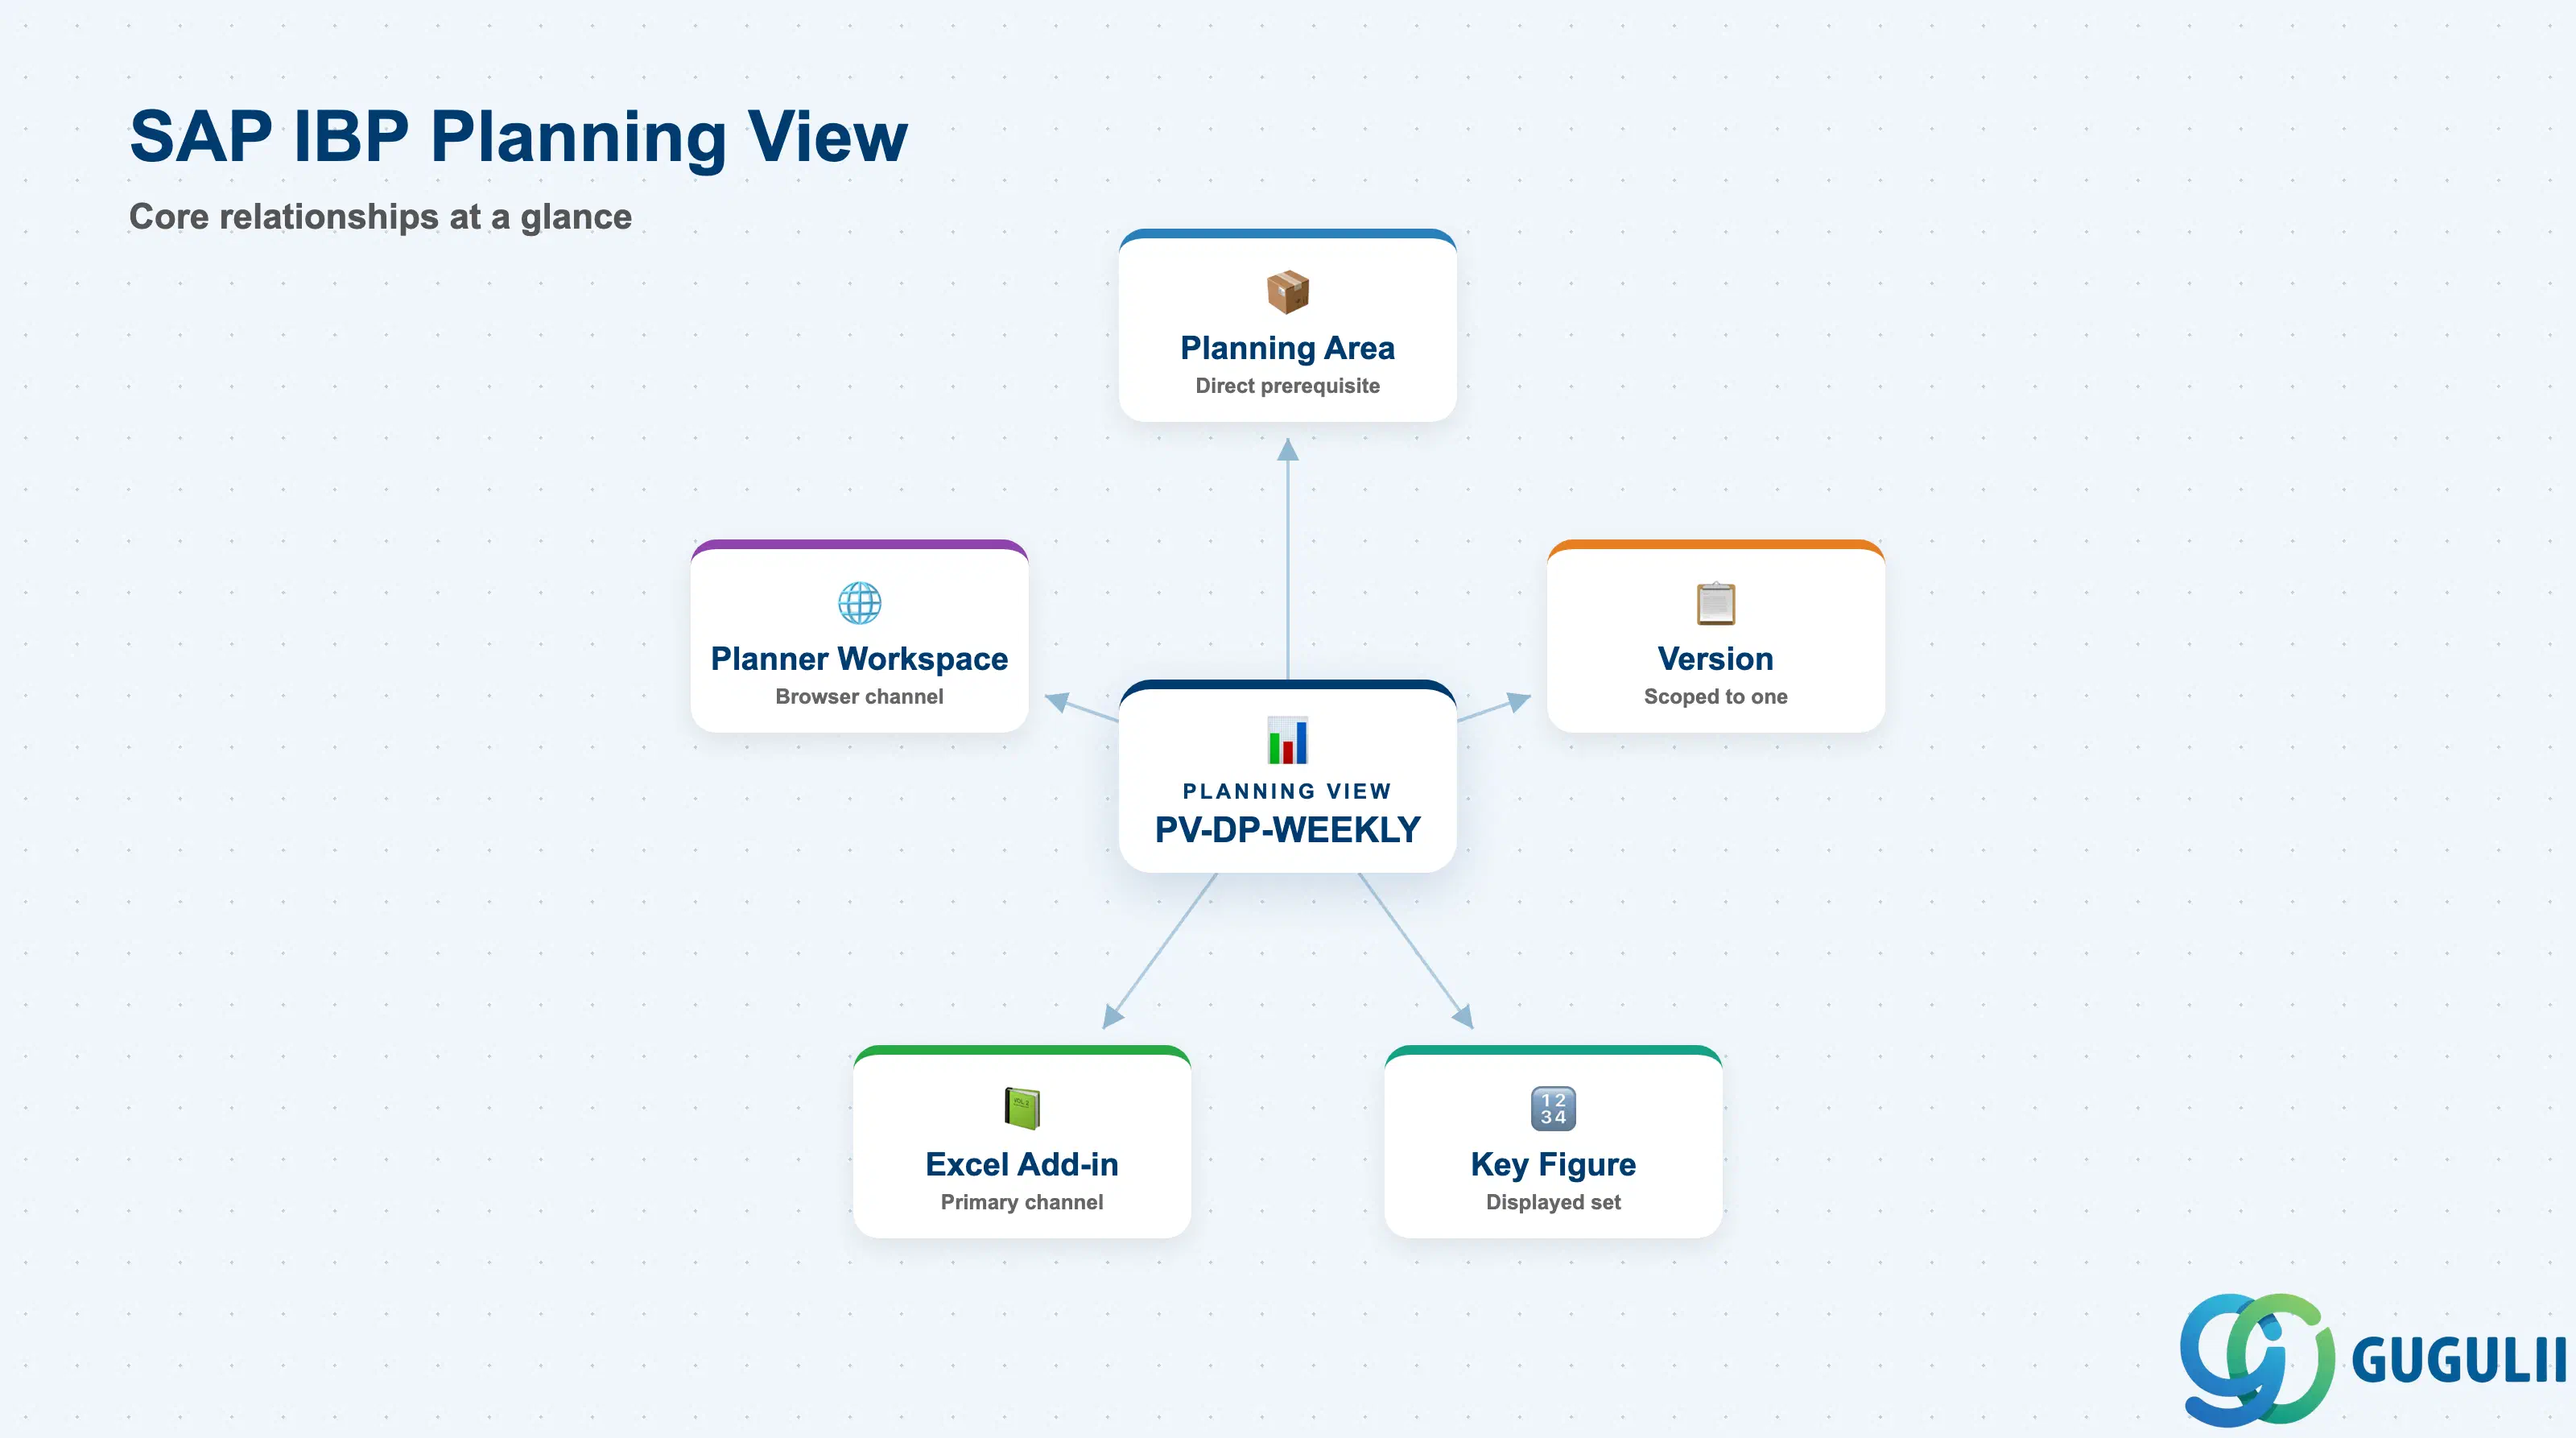
A Planning View holds no data of its own — it is a saved definition of which Key Figures appear, how they are arranged into rows/columns, what filters narrow the data down by default, and whether the resulting grid is editable. Once defined, it becomes the object a planner opens by name to work with a specific slice of a specific Version’s data.
| Aspect | Details |
|---|---|
| Role | A named, reusable screen layout (Key Figures + row/column arrangement + filters + edit permission) through which planners view and edit planning data |
| Prerequisite inputs | Three — Planning Area, Version, and Key Figure — tying Planning View for the widest fan-in of any object in this model, alongside Planning Area itself |
| Where it’s configured | The Configure Planning Views app (per the internal knowledge base’s Master Process table); administrators/configurators design the layout and select displayed Key Figures and filter conditions here |
| Consumption channels | Two — the SAP Integrated Business Planning add-in for Microsoft Excel (primary, SAP-documented channel) and the Planner Workspace app (Fiori/web-based counterpart) — the same configured View ID is renderable through either |
| Classification | The terminal object in this article group — no further downstream dependent within the Phase 2 series is covered here |
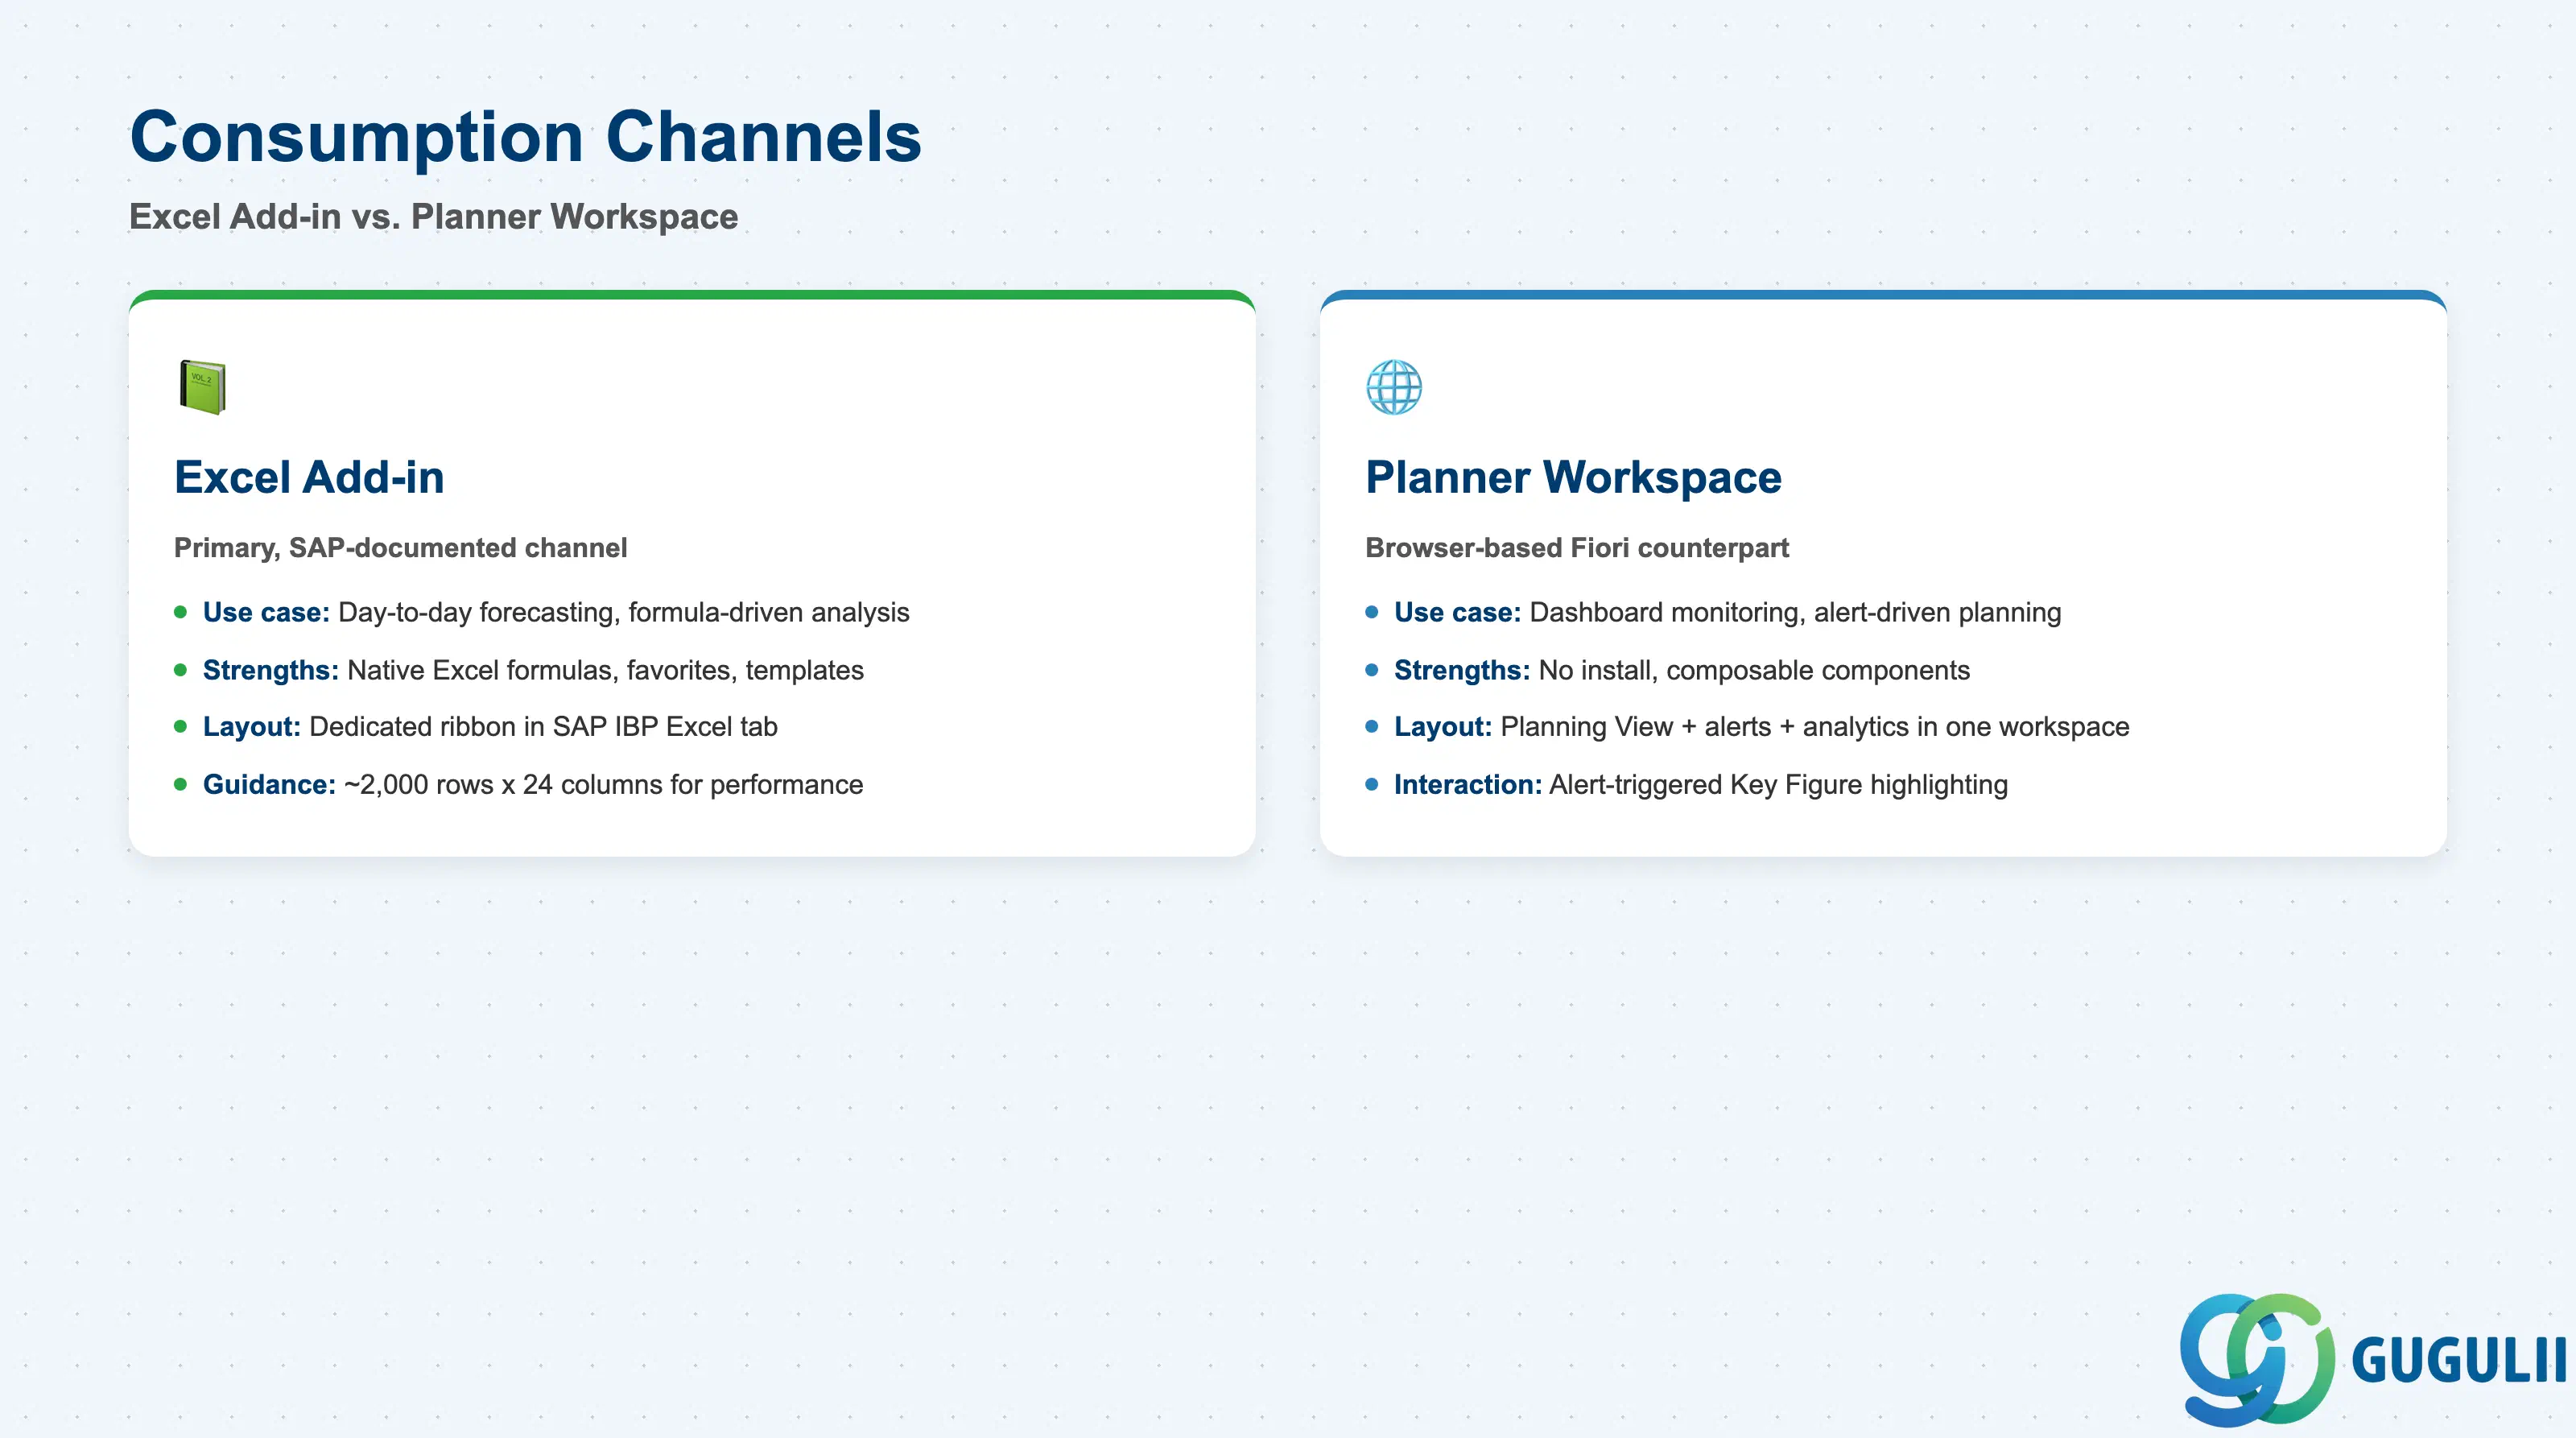
A Planning View is not tied to a single client application — the same View ID, Layout, Key Figures, Default Filters, and Edit Mode settings can be opened through either of two distinct consumption channels. Which channel a planner reaches for shapes their day-to-day workflow more than any other single choice in this article.
| Channel | Purpose | Use Case | Key Behavior |
|---|---|---|---|
| Excel Add-in | The primary, SAP-documented consumption channel | Day-to-day forecasting, formula-driven analysis, favorite/template-driven planning work | Adds a dedicated Planning View ribbon group to the SAP IBP Excel tab; supports native Excel formulas layered on top of Key Figure cells, multiple views coexisting on one worksheet, and saving frequently-used views as favorites |
| Planner Workspace | The browser-based, Fiori/web counterpart | Dashboard-style monitoring, alert-driven planning, no-install access | Embeds a Planning View alongside other component types — a custom-alerts overview, analytics charts — in one configurable workspace layout; components can interact (e.g. a Key Figure matching a triggered alert is highlighted directly inside the embedded view) |
Design principle: These are two rendering channels for one underlying object, not two different Planning View types. Public SAP documentation describes the Planner Workspace’s embedded planning view, alert overview, and analytics chart as separate, composable components laid out together in one workspace — not as a formally distinct “Analytics/Dashboard view” type sitting beside “Planning View.” This article does not assert that taxonomy; the View ID / Layout / Key Figures / Default Filters / Edit Mode settings covered in Section 2.1 remain the only documented configuration surface for a Planning View, regardless of which channel renders it.
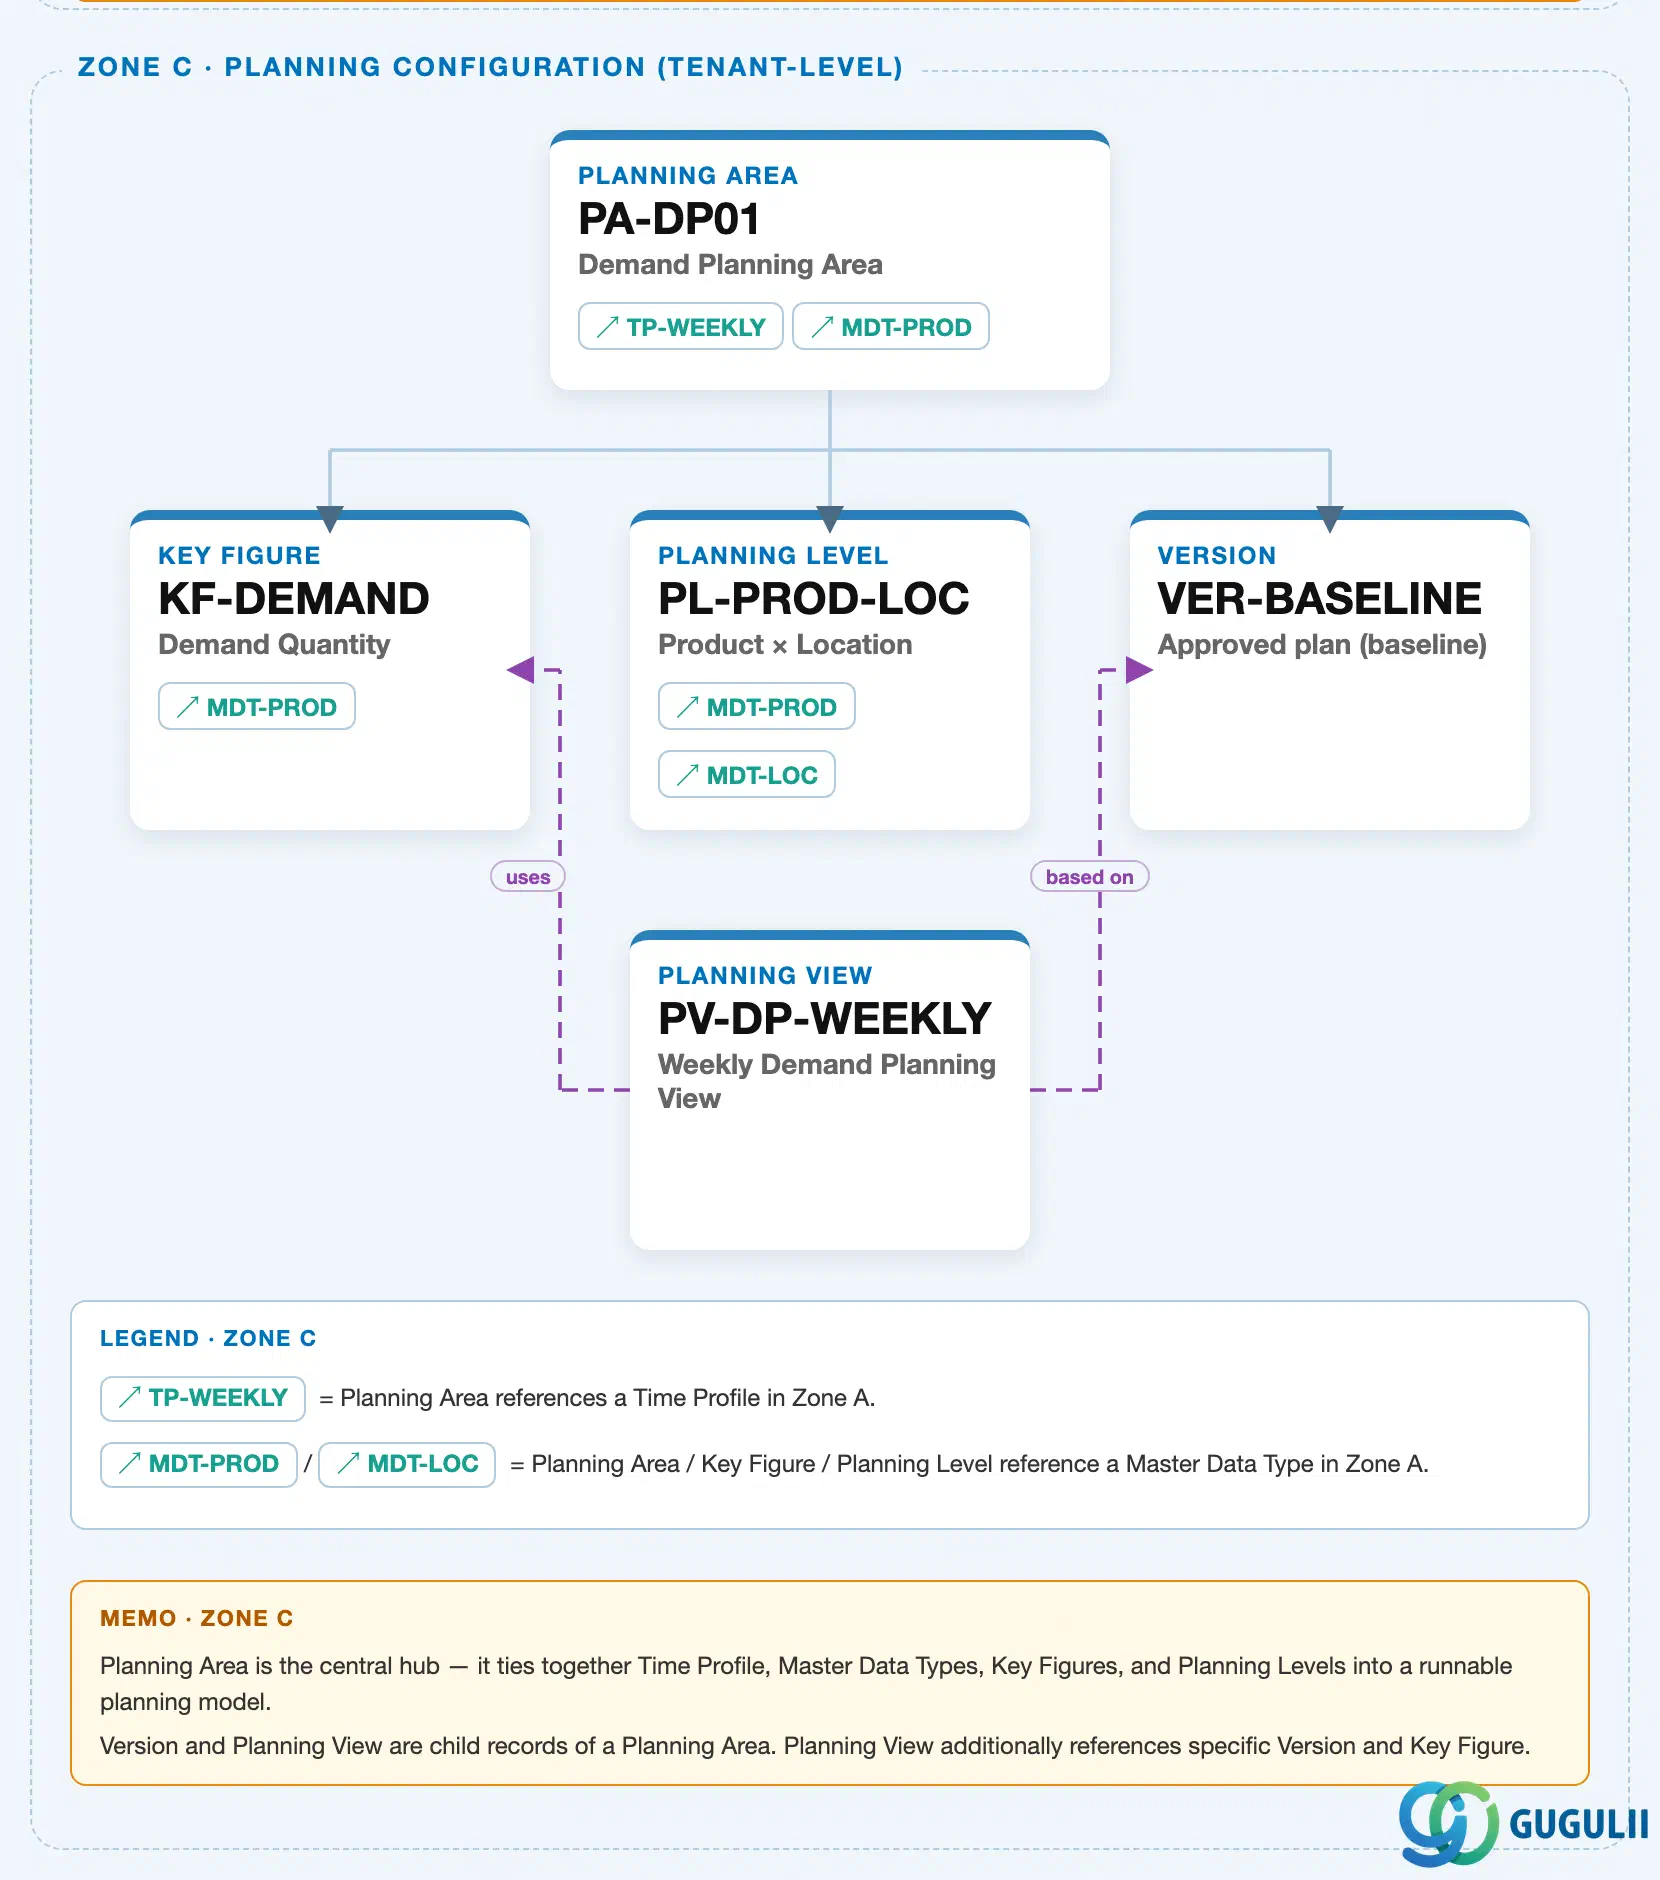
Data hierarchy with a concrete example
Client (SAP IBP Tenant)
   │
   └── Planning Area "PA-DP01" — Demand Planning Planning Area          (IBP-A03-03)
          │
          ├── Version "WORKING01" — Working                              (IBP-A03-04)
          │
          ├── Key Figure "SALESFCST" — Sales Forecast Qty                 (IBP-A03-01)
          │
          └── Planning View "PV-DP-WEEKLY" — Weekly Demand Planning View
                 │      [Row Axis: Product, Column Axis: Week, Filter: Location]
                 │
                 ├── scoped to ──> Version "WORKING01"
                 └── displays ──> Key Figure "SALESFCST"

   (rendering channel, not a Planning Area child — see Section 1.2 / 2.2-2.3)
   Excel Add-in worksheet, or Planner Workspace layout ── renders ──> Planning View "PV-DP-WEEKLY"
Design principle: Planning Area has a direct 1:N relationship into Planning View, the same as its 1:N relationship into Version — structurally, Planning View is a sibling of Version, not a child of Version, even though Version is also one of Planning View’s three prerequisite inputs. That distinction matters: a Planning View does not contain a Version, it references one, alongside a set of Key Figures — hence the dashed “scoped to” / “displays” arrows rather than nesting. The Excel Add-in and Planner Workspace are rendering channels, not org-hierarchy nodes at all; they sit outside the tree entirely, shown here only to make clear that neither channel owns the Planning View object itself.
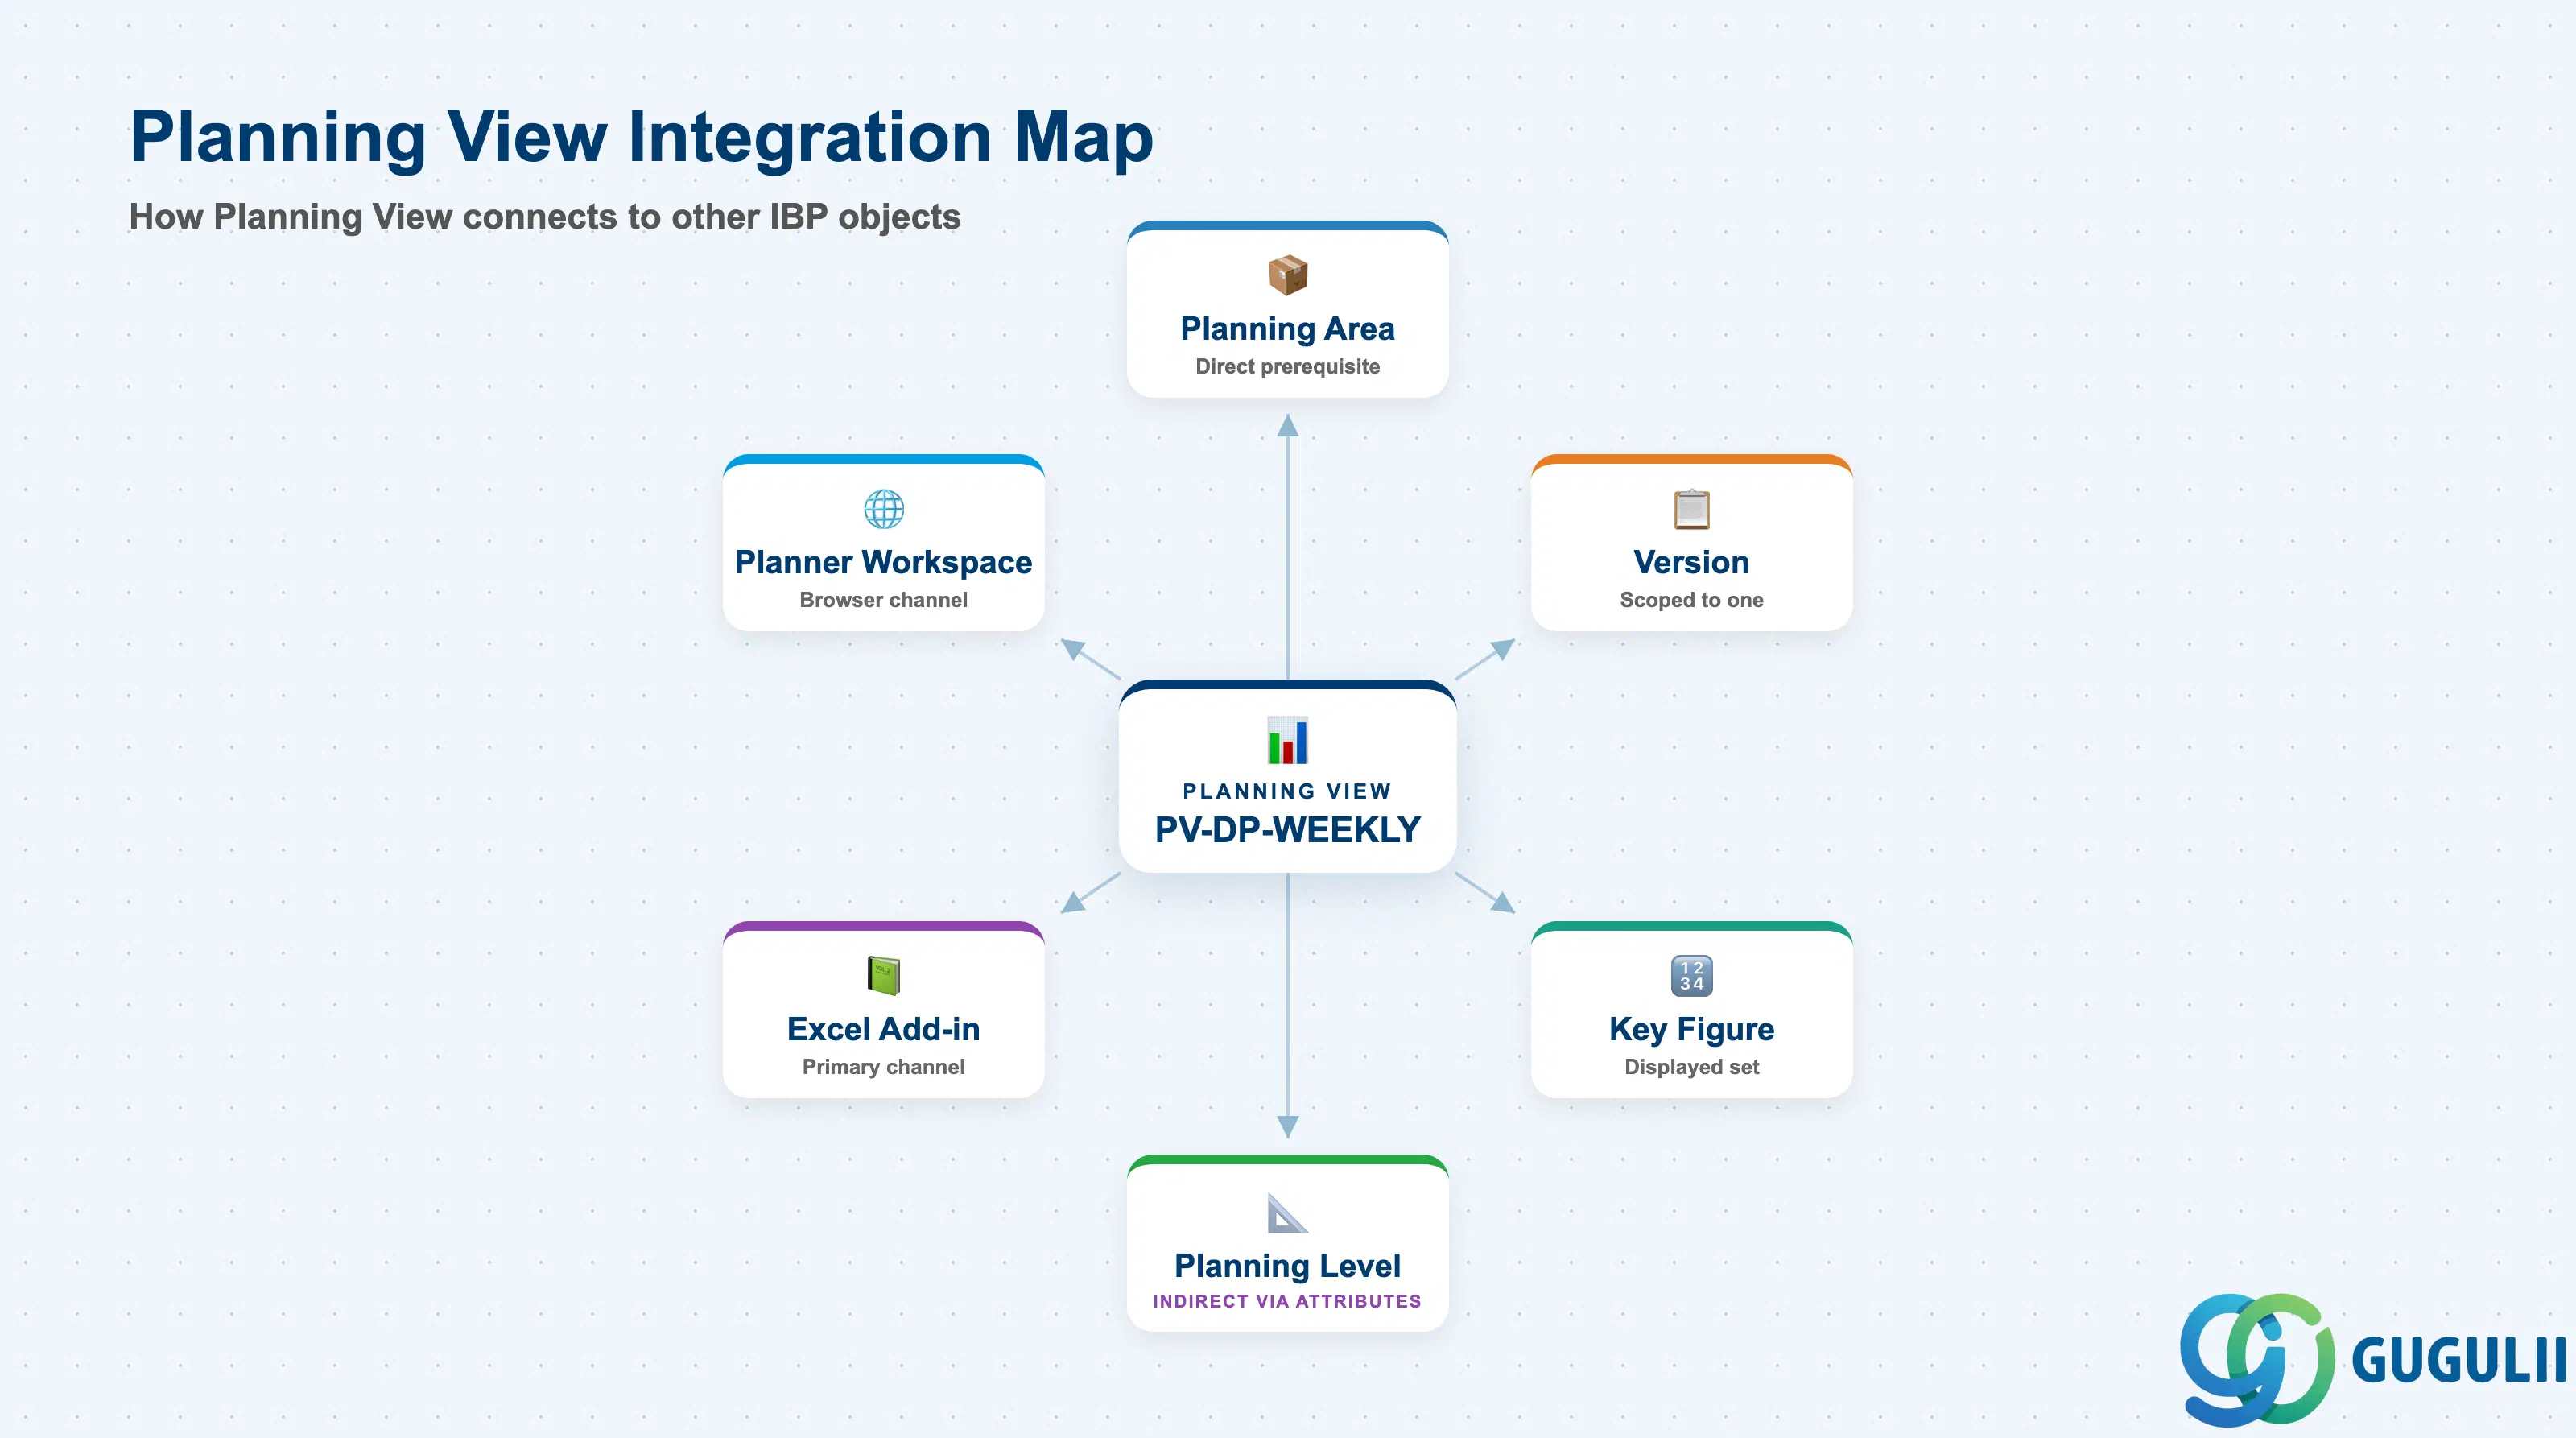
A Planning View does not stand alone — it is the presentation layer built directly on top of the three prior Phase 2 objects, plus an indirect dependency on Planning Level through the attributes available for filtering.
| Object | Relationship | Practical Notes |
|---|---|---|
| Planning Area | Direct prerequisite — a Planning View is built against one activated Planning Area’s container | Full mechanics in IBP-A03-03. Planning Area has a direct 1:N relationship into Planning View, in addition to its 1:N relationship into Version. |
| Version | Direct prerequisite — a Planning View is scoped to display and edit one Version’s data at a time | Full mechanics in IBP-A03-04. A planner typically opens the same View definition against different Versions (e.g. “Working” to enter numbers, “Simulation” to test a what-if). |
| Key Figure | Direct prerequisite — a Planning View displays a chosen set of Key Figures on its row/column axes | Full mechanics in IBP-A03-01. The Key Figures field in Section 2.1 is simply the inclusion list; each Key Figure’s own Storage Type and Aggregation/Disaggregation behavior was already fixed upstream. |
| Planning Level | Indirect dependency, via attributes — the Default Filters dropdown in a Planning View operates on the attributes exposed by the underlying Planning Level, not on arbitrary fields | Full mechanics in IBP-A03-02. Getting a Planning Level’s attribute set right upstream is what makes a Planning View’s filter options meaningful downstream. |
| Excel Add-in / Planner Workspace | Consumption channels, not master data objects — the two applications a planner uses to open a configured Planning View | Covered in full in Sections 2.2 and 2.3 of this article — the only place in this series these client applications are documented in depth. |
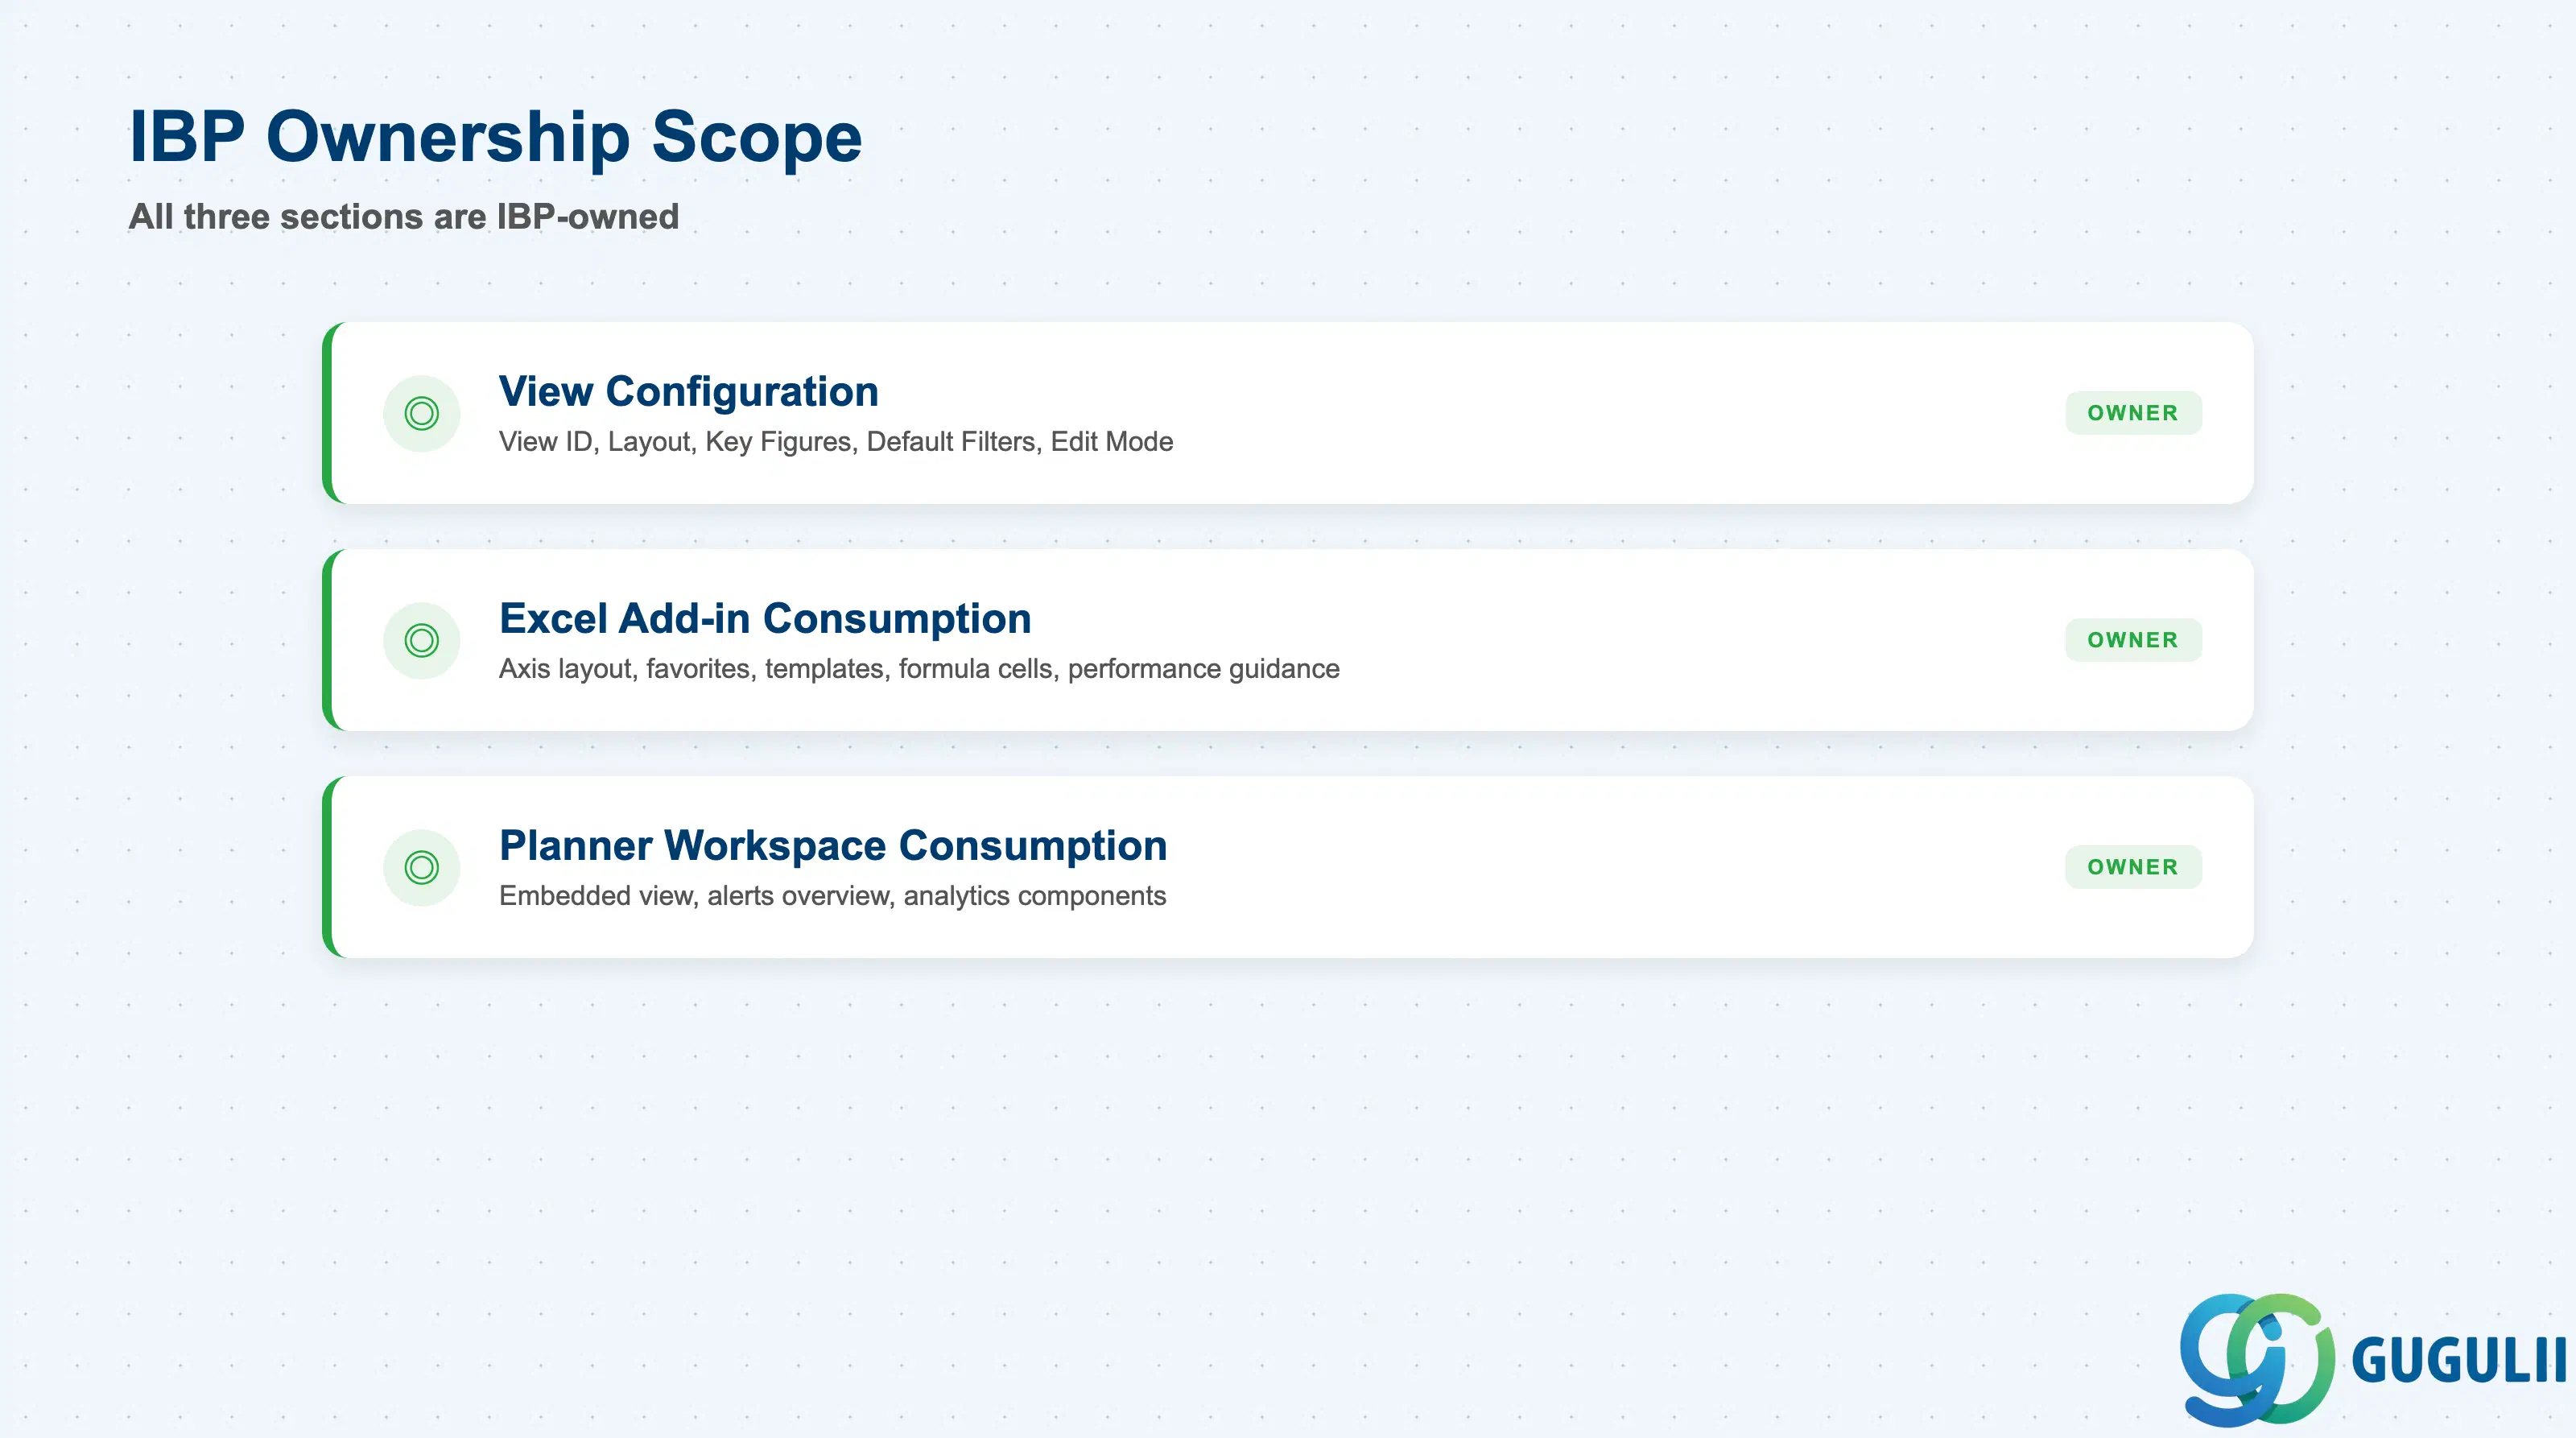
| Data Section | IBP Involvement | Notes |
|---|---|---|
| View Configuration | ◎ Owner | The five core settings set when a Planning View is created: View ID, Layout, Key Figures, Default Filters, Edit Mode |
| Excel Add-in Consumption | ◎ Owner | Row/column axis layout, favorites, templates, formula-enabled cells, and the ~2,000-row × 24-column performance guidance a consultant designs within |
| Planner Workspace Consumption | ◎ Owner | Embedding a configured Planning View inside a browser-based Planner Workspace layout, alongside alert overviews and analytics components |
Legend: ◎ = Owner / Critical
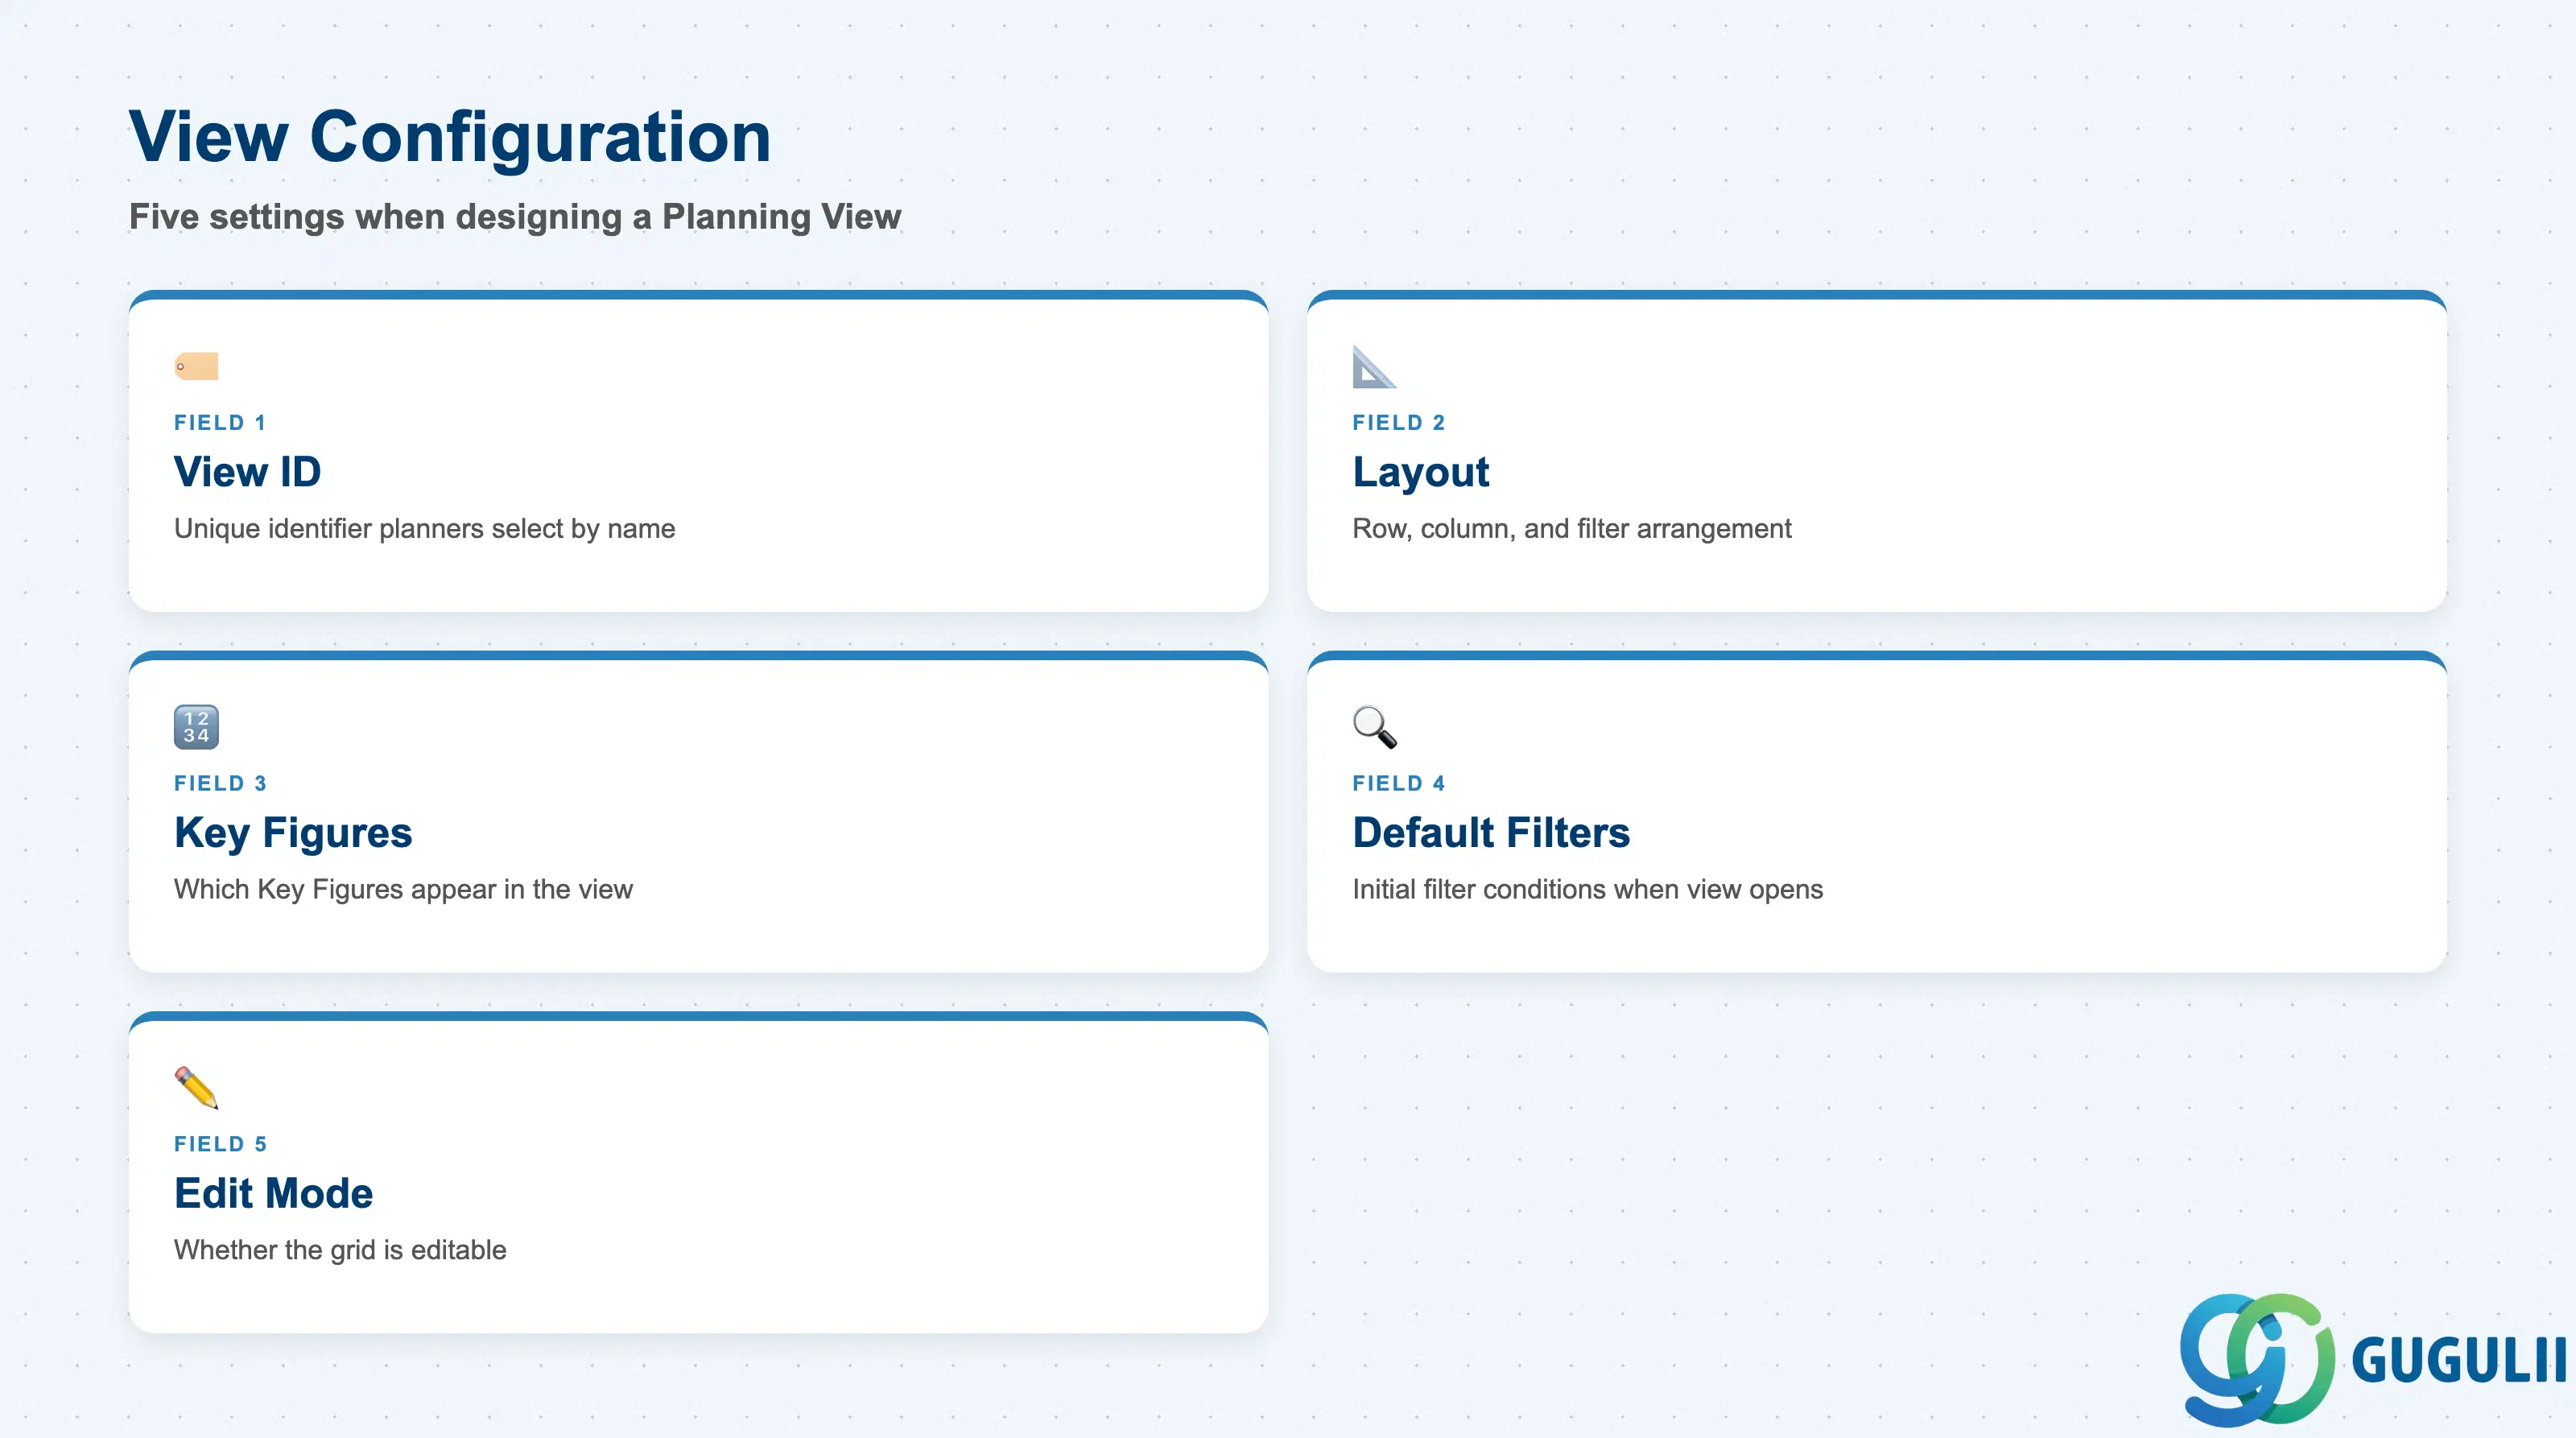
These are the five fields the internal knowledge base’s Planning View settings table lists — set inside the Configure Planning Views app when the view is first designed.
| Field | Description | Practical Usage |
|---|---|---|
| View ID | Unique identifier for the Planning View | Adopt a naming convention that reflects the planning process it serves (e.g. PV-DP-WEEKLY for a weekly demand planning view) — planners select views by this name, so keep it business-readable, not just technical. |
| Layout | The row/column/filter arrangement of the view | Layout is fully configurable per view — a common pattern places Key Figures on the column axis and time periods on the row axis, but any assignment is valid. Design this around how the planner reads the grid, not around convenience during configuration. |
| Key Figures | Which Key Figures are displayed in the view | Each Key Figure included here was already defined with its own Storage Type and base Planning Level (IBP-A03-01) — this field is simply the display/edit inclusion list for this specific view. |
| Default Filters | The initial filter conditions applied when the view opens | Operates on the attributes exposed by the underlying Planning Level (Section 1.4) using operators such as “is equal to” or “is not equal to” — a planner can broaden or narrow the filter after opening, but a well-chosen default saves repetitive re-filtering every session. |
| Edit Mode | Whether the view is editable | Only Stored (or Stored+Calculated hybrid) Key Figures can actually accept manual input regardless of this setting (IBP-A03-01, Section 1.2) — flipping Edit Mode on for a view built entirely from Calculated Key Figures has nothing to write to. |
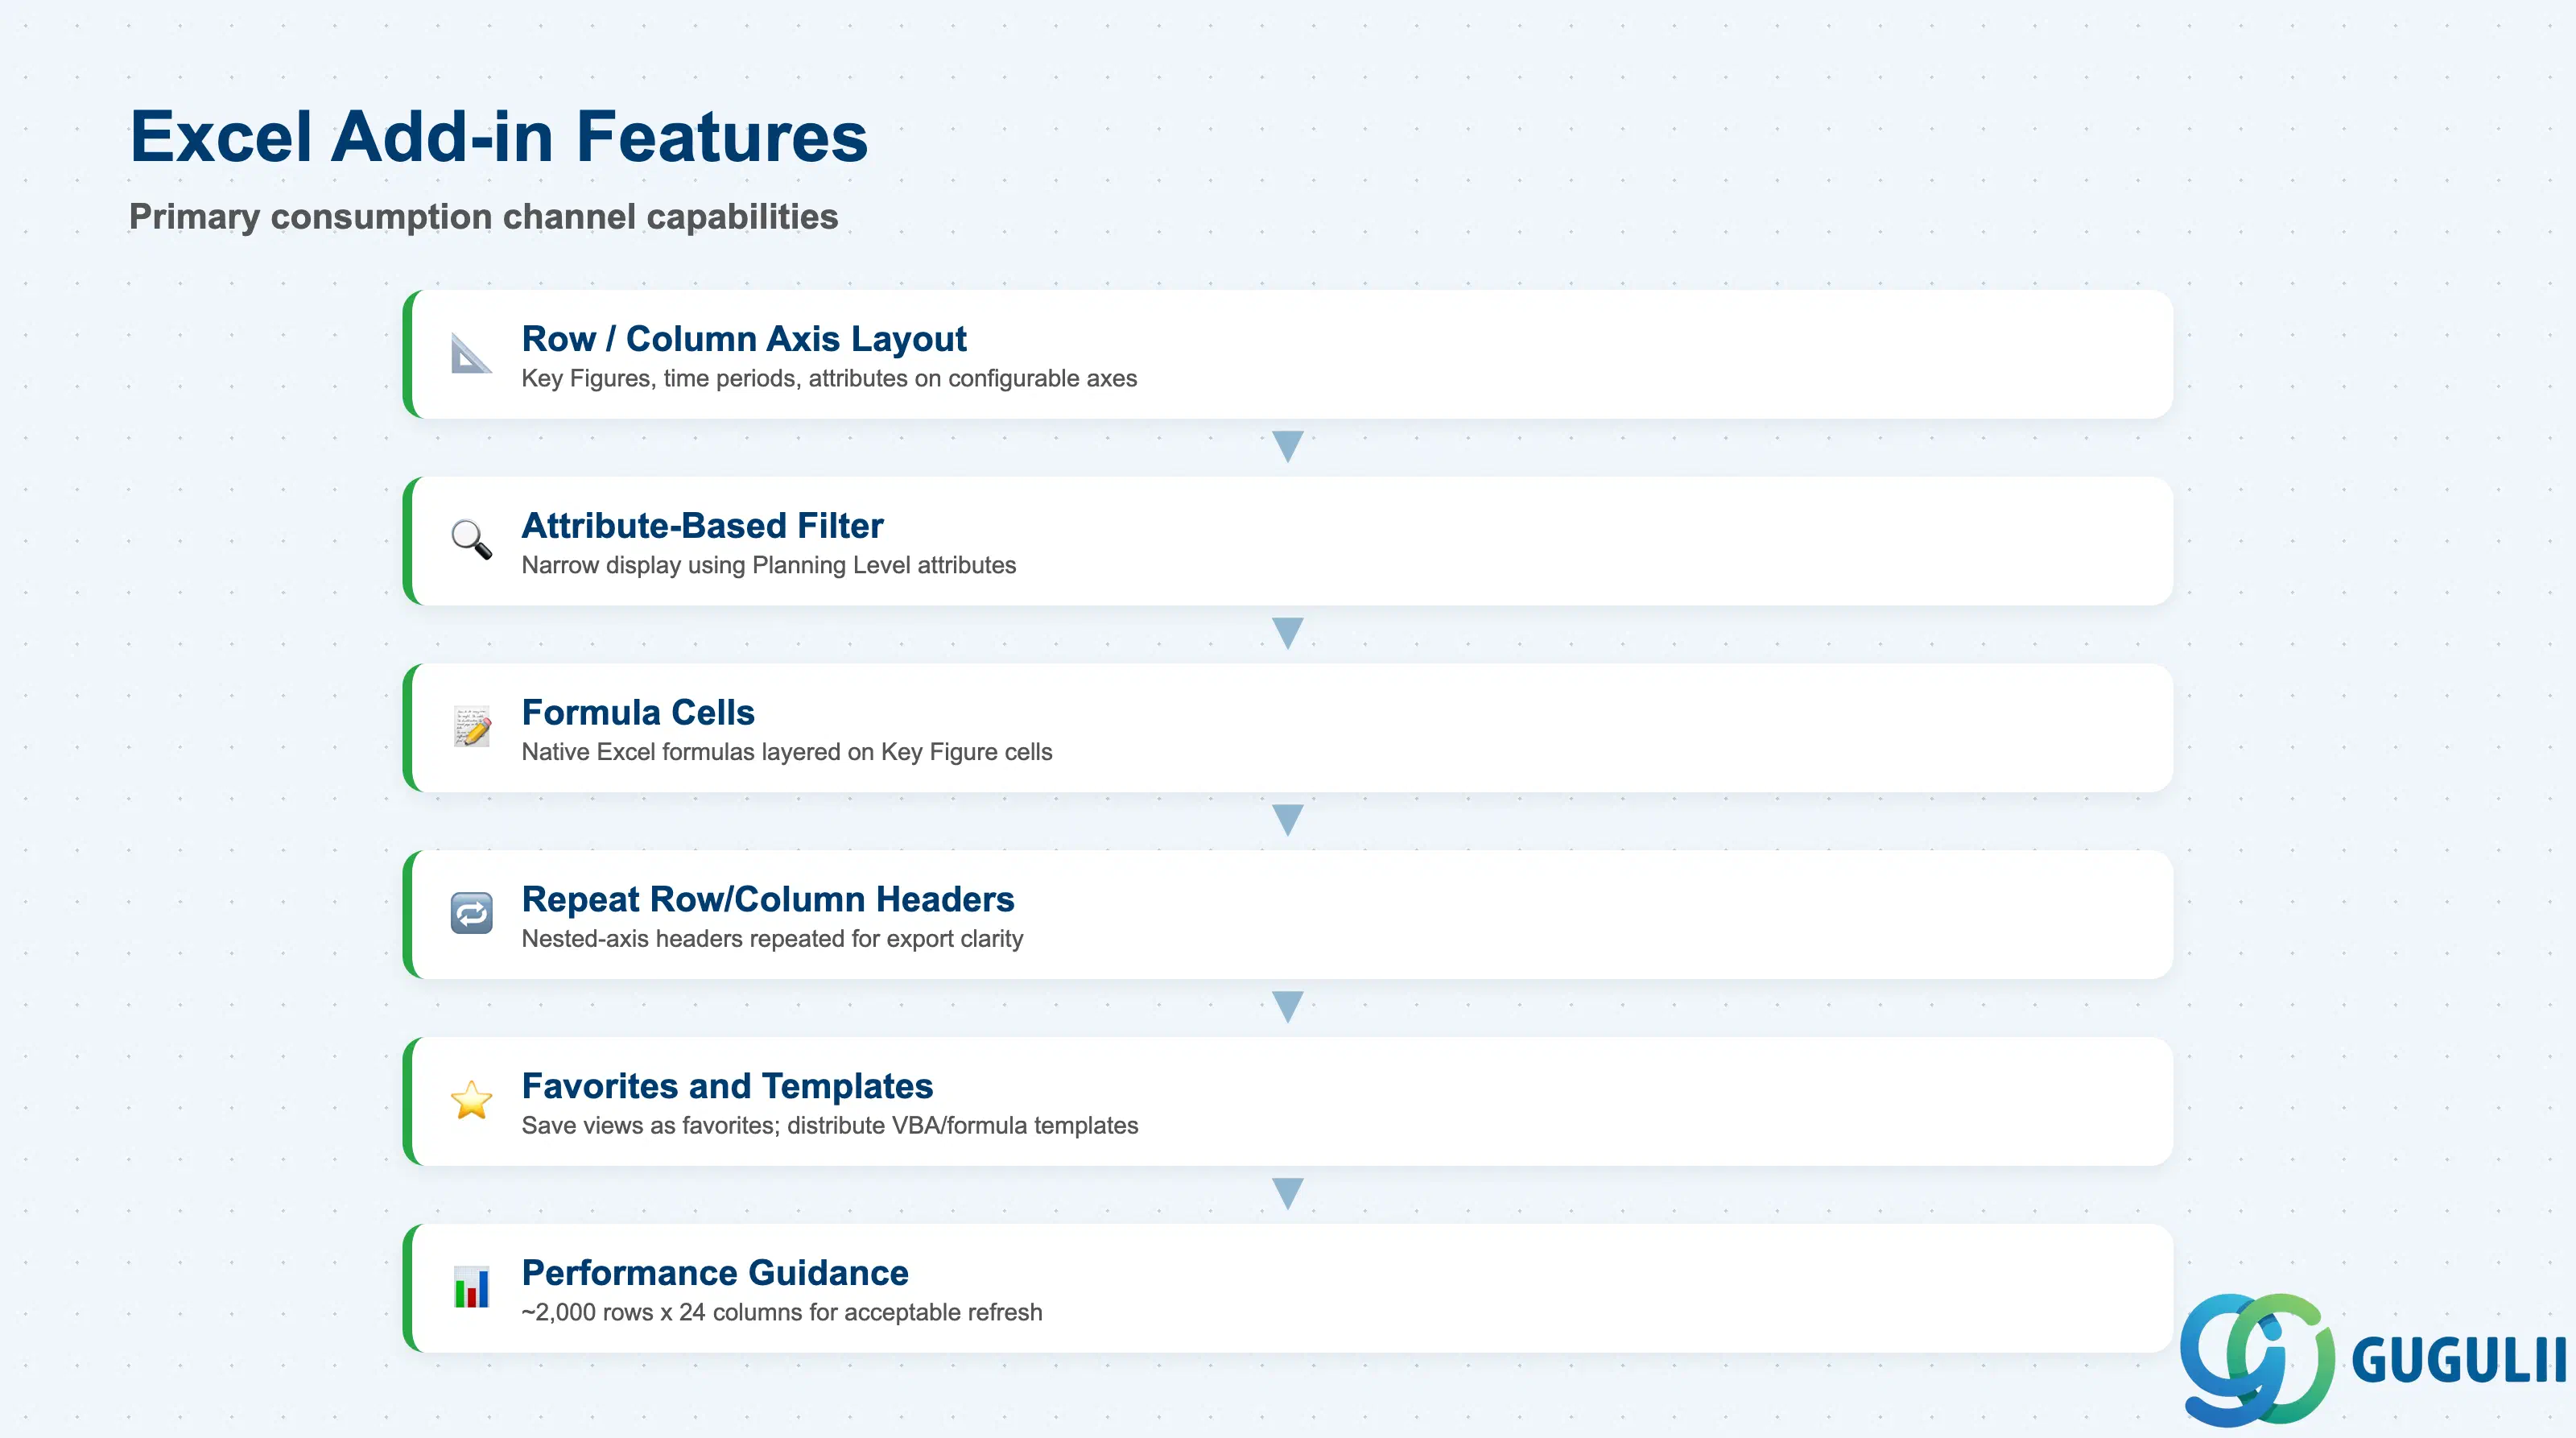
The SAP Integrated Business Planning add-in for Microsoft Excel is the primary, SAP-documented channel through which planners and analysts work with Planning Views. A dedicated Planning View ribbon group in the SAP IBP Excel tab provides creation/customization, favorites, and filter management.
| Field / Concept | Description | Practical Usage |
|---|---|---|
| Row / Column Axis Layout | Members (Key Figures, time periods, Planning Level attributes such as Product or Customer) are placed on a row axis and a column axis, fully configurable per view | A common pattern places Key Figures on columns and time periods on rows, but attributes can also be placed on either axis (e.g. breaking out receipts by Product and Customer on the column axis) — design the axis assignment around the review workflow, not a fixed convention. |
| Attribute-Based Filter | Users define which planning combinations display by specifying attribute values with operators like “is equal to” / “is not equal to” | This is the mechanical link to Section 1.4’s Planning Level dependency — a filter can only offer the attributes the view’s underlying Planning Level actually exposes. |
| Formula Cells | Users can add extra rows/columns with native Excel formulas, which the add-in converts and propagates into the IBP formula layer | Useful for row/column totals or derived figures layered on top of the plain Key Figure display, without requiring a new Calculated Key Figure to be built server-side for a one-off view. |
| Repeat Row/Column Headers | Nested-axis views can repeat outer-dimension headers on every inner row/column | Turn this on when the resulting grid will subsequently be Excel-filtered or exported — without it, a filtered/exported subset loses the outer grouping context. |
| Favorites & Templates | Frequently-used views can be saved as favorites; administrators distribute VBA-based, formula-based, or macro-free Planning View templates to drive end-user adoption | Most end users do not build a view’s row/column/filter layout from scratch — they open a distributed template “from favorites.” Formula-based templates have a documented constraint: embedded chart functionality only processes up to 300 rows, tighter than the general performance guidance below. |
| Performance Guidance | SAP-documented sizing guidance: keep a Planning View to roughly under 2,000 rows × 24 columns for acceptable refresh performance | An example view of 80 Key Figures × 24 months refreshes in about 5 seconds under this guidance. A broad Planning Level scope (many attribute combinations) multiplied by many Key Figures can exceed this quickly — validate row/column/filter scope against this ceiling during design, not after planners report slow refreshes. |
Coverage note: SAP Note 1790530 is cited in SAP’s own sample-template documentation as the authoritative reference for Planning View template development best practices. It requires an S-user login and was not accessible under this pipeline’s public-knowledge-only constraint — any specific technical recommendations from that note are omitted here rather than guessed at.
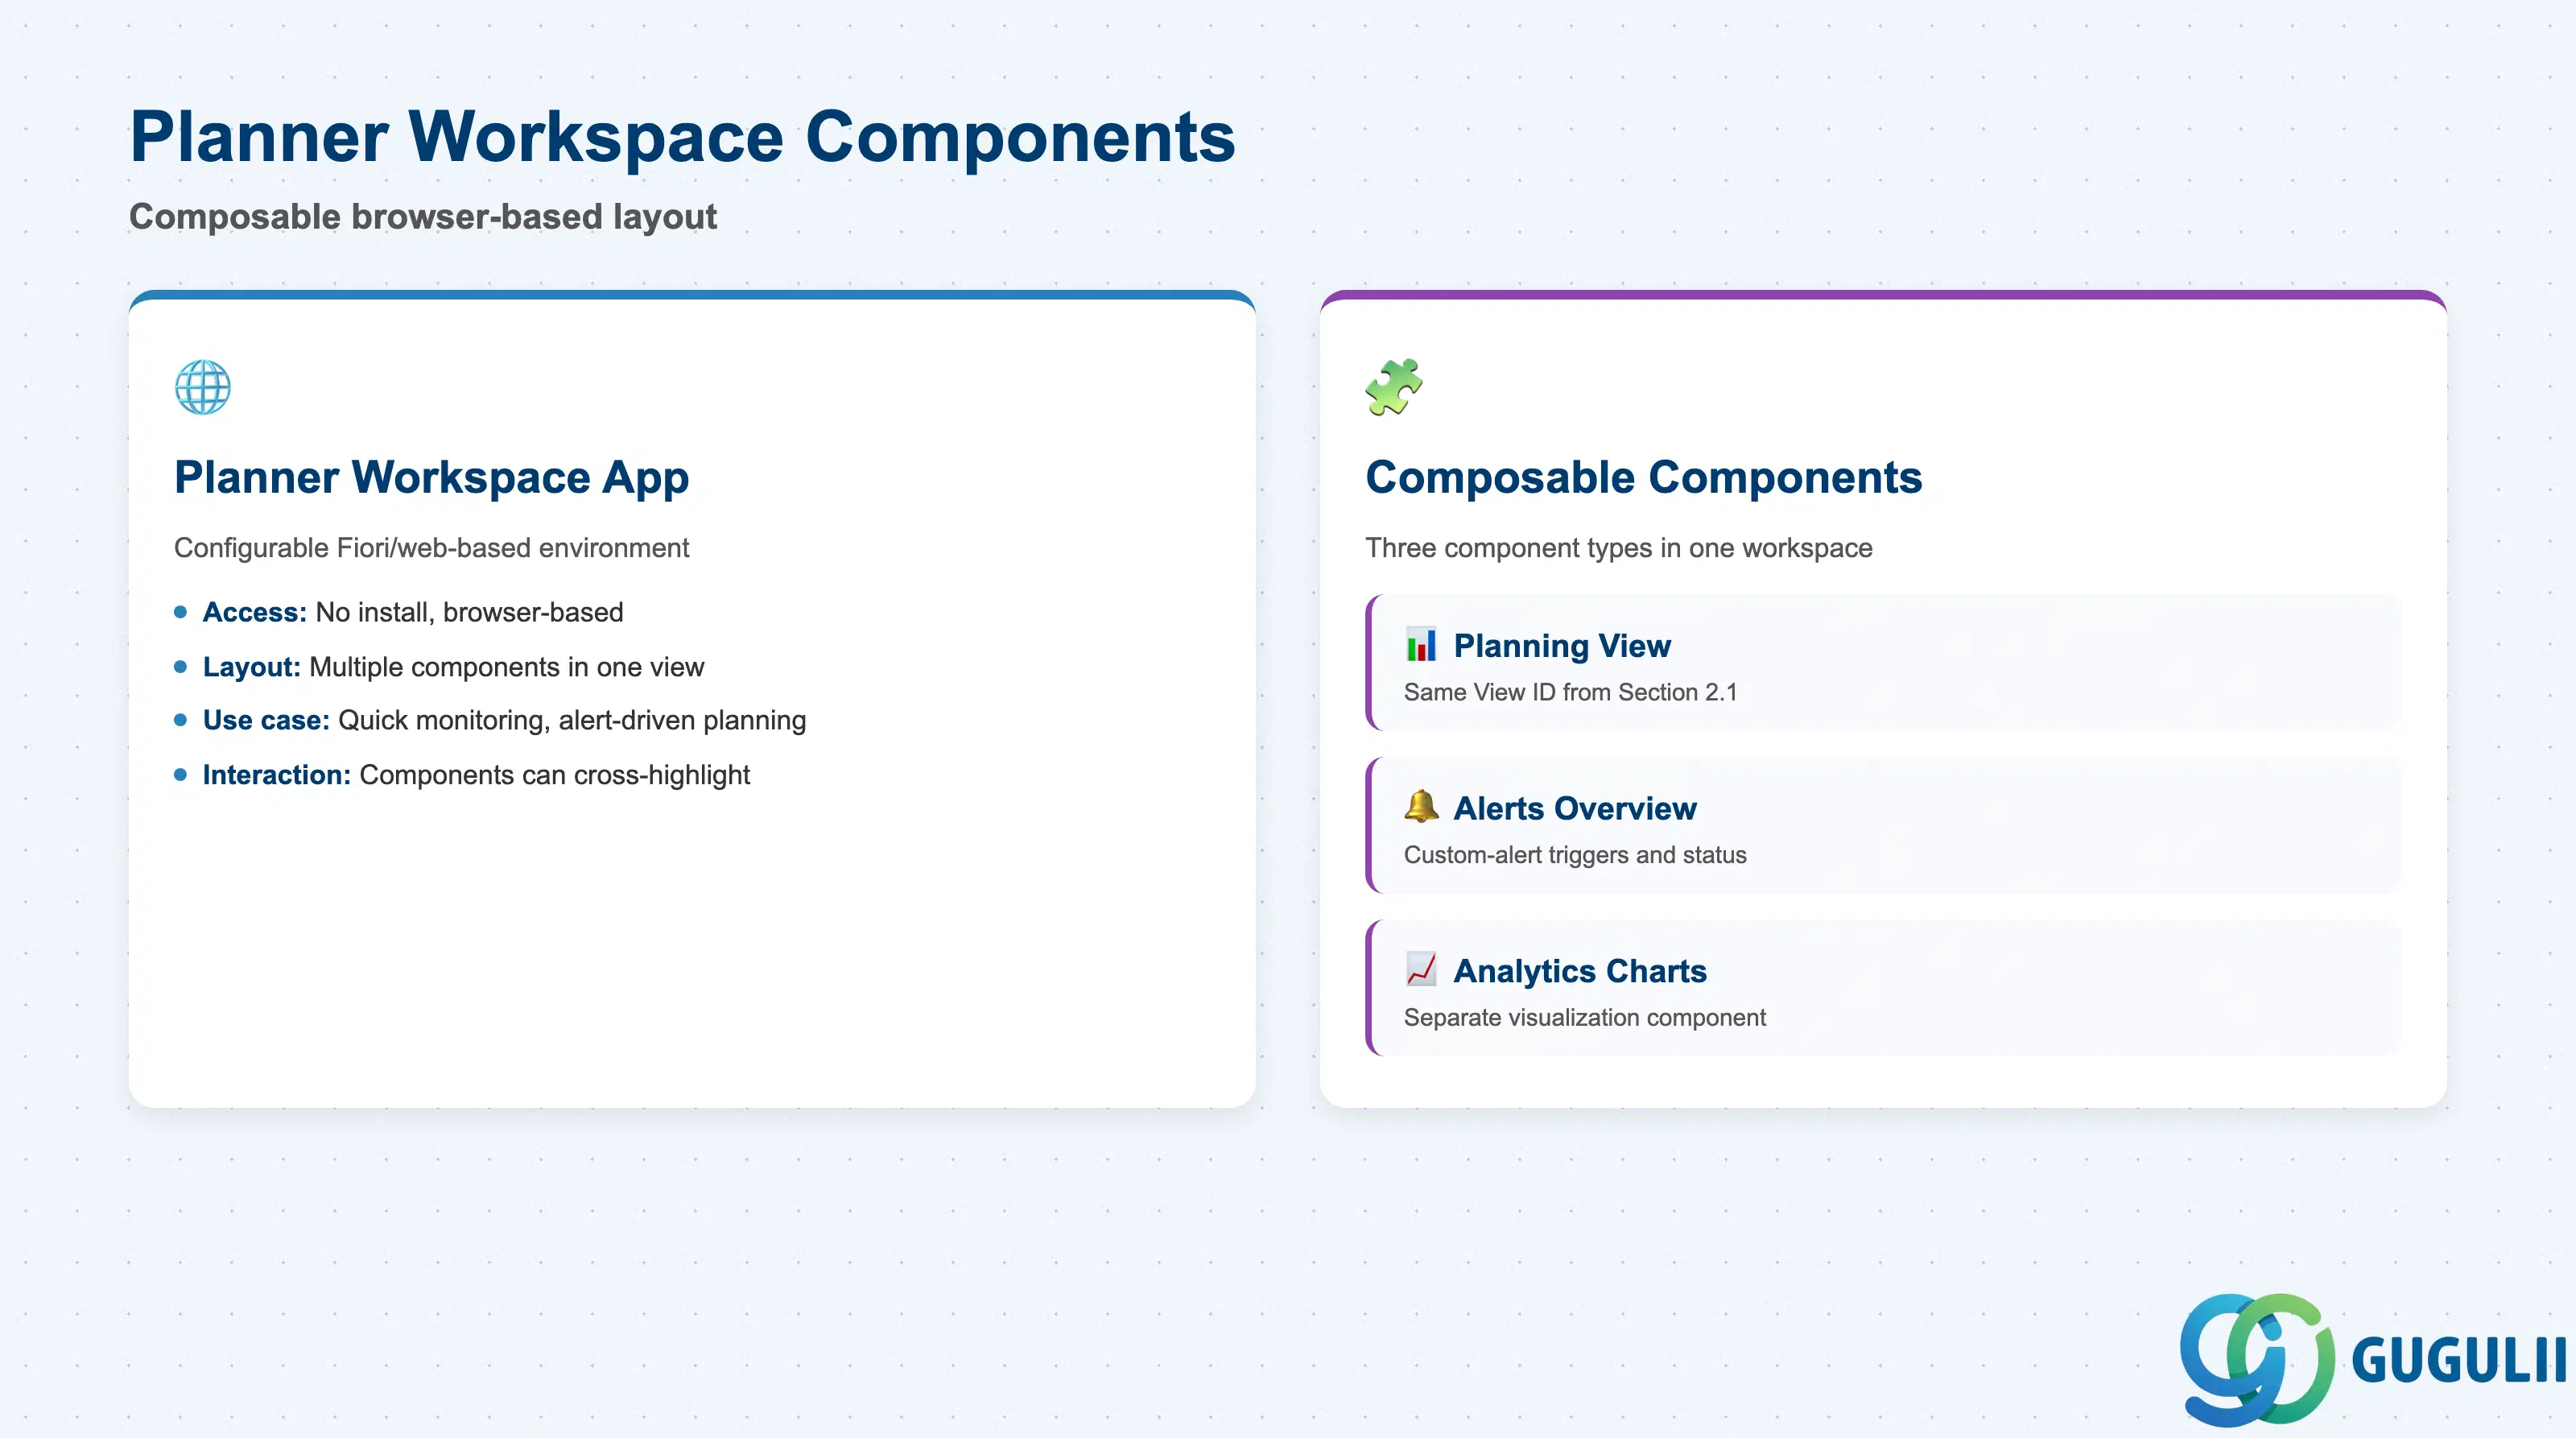
The Planner Workspace app is SAP’s Fiori/web-based counterpart to the Excel add-in: a configurable, browser-accessible environment where planners plan, review alerts, and run simulations without needing Excel installed.
| Field / Concept | Description | Practical Usage |
|---|---|---|
| Planner Workspace app | A configurable, browser-based work environment for planning, alert review, and simulation | The no-install, dashboard-style alternative to the Excel Add-in — useful for planners who need quick, occasional access rather than deep formula-driven analysis. |
| Embedded Planning View component | The same View ID, Layout, Key Figures, Default Filters, and Edit Mode settings from Section 2.1, rendered as one component inside a Planner Workspace layout | Configuring a Planning View once in Section 2.1 is sufficient for both channels — there is no separate “Planner Workspace version” of the view’s settings to maintain. |
| Custom-alerts overview component | A separate, composable component that can be laid out alongside an embedded Planning View in the same workspace | Components can interact: a Key Figure matching a triggered custom alert can be highlighted directly inside the embedded Planning View, giving the planner a visual cue without leaving the workspace. |
| Analytics components | Analytics charts are a separate, composable component type available within a Planner Workspace layout, alongside the embedded Planning View and alerts overview | Do not present this as a distinct “Analytics/Dashboard view” type of Planning View — SAP documentation treats it as one more component a workspace can lay out beside a Planning View, not a variant of the Planning View object itself (see Section 1.2 design principle). |
Coverage note: Direct fetches of the Planner Workspace Help Portal pages during research returned only client-side tracking script rather than rendered documentation, so the findings above are drawn from corroborating indexed search snippets rather than a single fully-verified page render. Treat the component-composition framing as well-corroborated but not independently confirmed against a raw page fetch.
| ID | Category | Title |
|---|---|---|
| ibp-001 | Overview | What is SAP IBP? |
| ID | Category | Title |
|---|---|---|
| ibp-a01 | Overview | SAP IBP Master Data: Overview, Hierarchy & Relationships |
| ibp-a02-01 | Master Data | SAP IBP Master Data Types |
| ibp-a02-02 | Master Data | SAP IBP Attribute |
| ibp-a02-03 | Master Data | SAP IBP Time Profile |
| ibp-a02-05 | Master Data | SAP IBP Location Master |
| ibp-a03-01 | Master Data | SAP IBP Key Figure |
| ibp-a03-02 | Master Data | SAP IBP Planning Level |
| ibp-a03-03 | Master Data | SAP IBP Planning Area |
| ibp-a03-04 | Master Data | SAP IBP Planning Version |
| ibp-a03-05 | Master Data | SAP IBP Planning View 📍 |
| ibp-a04-01 | Master Data | SAP IBP Integration Model |
| ibp-a05-01 | Master Data | SAP IBP Planning Operator |
| ID | Category | Title |
|---|---|---|
| ibp-b01 | Overview | SAP IBP Transactions: Process Flow, Hierarchy & Relationships |